

Join Our Telegram channel to stay up to date on breaking news coverage
XRP Price Prediction – July 8
For now, XRP/USD is getting more comfortable as the price pushes above $0.20 with a daily increase of over 9%. Will this momentum continue?
XRP/USD Market
Key Levels:
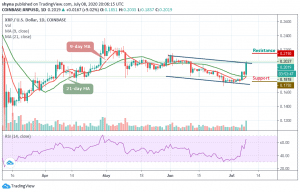
Resistance levels: $0.215, $0.220, $0.225
Support levels: $0.175, $0.170, $0.165

XRP/USD settles above $0.200 amid global recovery on the cryptocurrency market. The third-largest digital asset has gained nearly 9.02% in the recent 24 hours and touches the intraday high at $0.203 before retreating to $0.201. A few weeks ago, XRP/USD had previously dropped after the cryptocurrency failed to overcome resistance at the $0.215 level which caused it to roll over and fall.
However, as the technical indicator RSI (14) moves above 60-level, a breakout of the upper boundary of the channel could confirm that XRP/USD is heading toward the next potential resistances. Meanwhile, if the price collapses below 9-day and 21-day moving averages, the market will turn bearish, and critical support levels could be reached at $0.175, $0.170, and $0.165 respectively.
Moreover, if the buyers can break above the channel at $0.205, the first level of resistance lies at $0.210 level. Any further movement above this could lead to the resistance levels of $0.215, $0.220, and $0.225 as the technical indicator moves toward the overbought zone. More so, entering into this zone may further confirm the bullish trend.
When compares against BTC, XRP is moving at the upside of the channel. Meanwhile, the price action has remained intact within the channel and if the buying pressure continues, the XRP/BTC price variation may create a new monthly high. At the moment, the signal line of RSI (14) may soon touch 70-level; traders may continue to see a positive move in the market as much as the coin continues to trade above the moving averages.
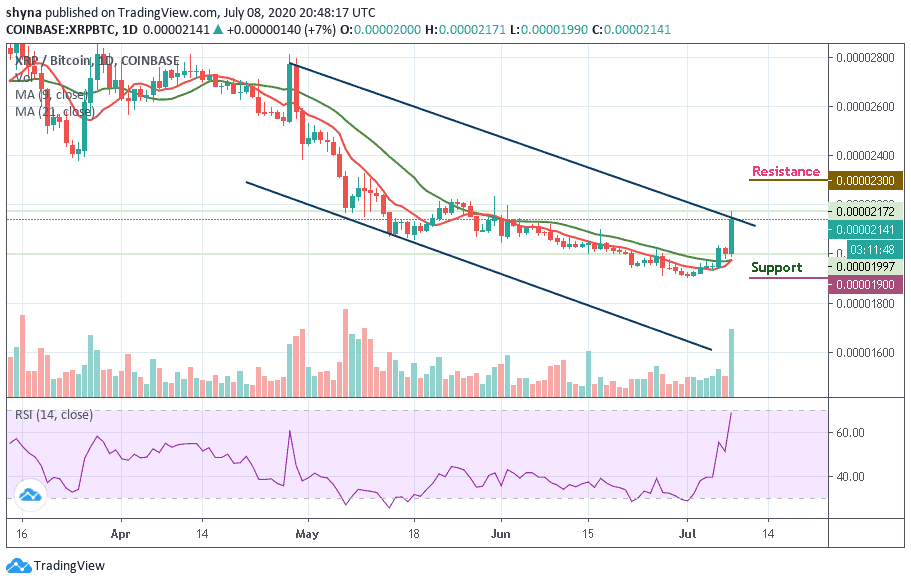
As the daily chart reveals, XRP/BTC is currently moving at 2141 SAT which is around the upper boundary of the channel. Traders may expect close resistance at 2200 SAT before breaking to 2300 SAT and above. However, should in case a bearish movement occurs and validates a break below the moving averages; we can then confirm a bearish movement for the market, and the nearest support levels to reach lies at 1900 SAT and below.
Join Our Telegram channel to stay up to date on breaking news coverage
