Join Our Telegram channel to stay up to date on breaking news coverage
Bitcoin (BTC) Price Prediction – July 8
The Bitcoin price hits the major resistance level at $9,469 instead of battling with supports.
BTC/USD Long-term Trend: Bearish (Daily Chart)
Key levels:
Resistance Levels: $10,000, $10,200, $10,400
Support Levels: $8,700, $8,500, $8,300

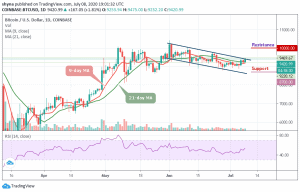
BTC/USD hits the price area around $9,469 after almost a weeklong of despairing trade. As the daily chart reveals that the coin is currently correcting upwards, we believe that BTC/USD is likely to cross resistances instead of just battling inactive supports. Today, BTC/USD is seen trading at $9,420 after closing at $9,220 yesterday.
However, the coin then pulled back to where it is trading currently and may continue to head upward if the bulls stand firm within the market. Looking at the daily chart, BTC/USD is now trading above the crucial levels that will now function as the support zones in the event a reversal occurs.
Meanwhile, on the upside, as the coin moves above the 9-day and 21-day moving averages, little is in place to prevent correction targeting the key resistance of $9,200 as the technical indicator RSI (14) moves above the 50-level.
Nevertheless, the bulls are currently banking on the support at $8,700, $8,500, and $8,300 to ensure that in spite of a reversal, the Bitcoin price stays above $9,400 level. Similarly, the nearest resistance levels to watch for are $10,000, $10,200, and $10,400 respectively.
BTC/USD Medium – Term Trend: Bullish (4H Chart)
The 4-hour chart for BTC is still looking bullish as the market has been showing a sign of bullish trend since the daily opening. However, the intraday trading is still looking bullish; following the recent rebound at $9,253 which is now a key support level. The next key support levels are $9,250 and below.
However, considering the recent sharp rebound, the Bitcoin price may continue the bullish rally to $9,500 resistance. A climb above the mentioned resistance may further push BTC price to $9,600, $9,800, and $10,000 resistance levels. As it appeared now, it seems the bulls may likely return into the market as the RSI (14) moves into the overbought zone, suggesting more bullish signals.
Join Our Telegram channel to stay up to date on breaking news coverage


