

Join Our Telegram channel to stay up to date on breaking news coverage
XRP Price Prediction – April 20
Looking at the daily chart, the Ripple (XRP) price breaks below $0.190 level, more pain ahead.
XRP/USD Market
Key Levels:
Resistance levels: $0.220, $0.230, $0.240
Support levels: $0.160, $0.150, $0.140
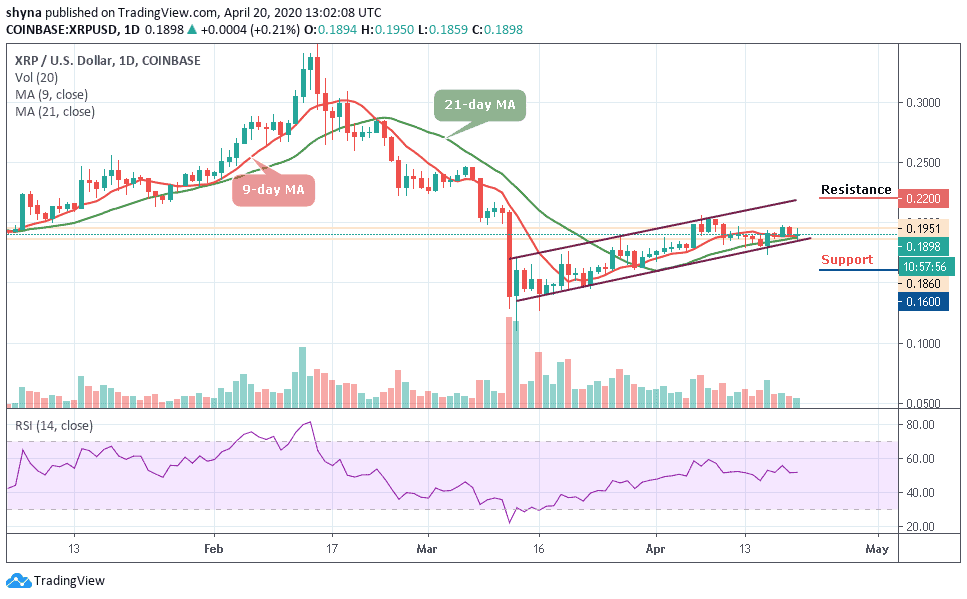
Since the Ripple price hit $0.197 level on April 18, XRP/USD has been range-bound with bearish bias; however, yesterday, a strong sell-off pushed the price below the support level and created strong downside momentum. Today, the daily chart reveals that the price hit the low of $0.186 before recovering towards $0.189 at the time of writing.
Moreover, the immediate upside is limited by the 9-day and 21-day moving averages. It is apparent that buyers are working hard to kick off this week’s trading above the moving averages. Stepping above this could easily increase the bulls’ influence as they change their focus from $0.200 to higher levels at $0.220, $0.230 and $0.240 resistance levels.
However, if the market experiences any slight drop during this movement, it may likely cross below the lower boundary of the ascending channel hit the nearest support at $0.175 and a further drop could pull the market to $0.160, $0.150 and $0.140 supports.
Nonetheless, the technical indicator RSI (14) for XRP/USD is slowly moving around 51-level, which indicates that the market may follow the sideways movement in the nearest term.
Against Bitcoin, the market is still trading in a symmetrical triangle trading below the 9-day and 21-day moving averages. The Ripple (XRP) is yet to break out of the symmetrical triangle. However, from the upside, the nearest levels of resistance lie at 2800 SAT.
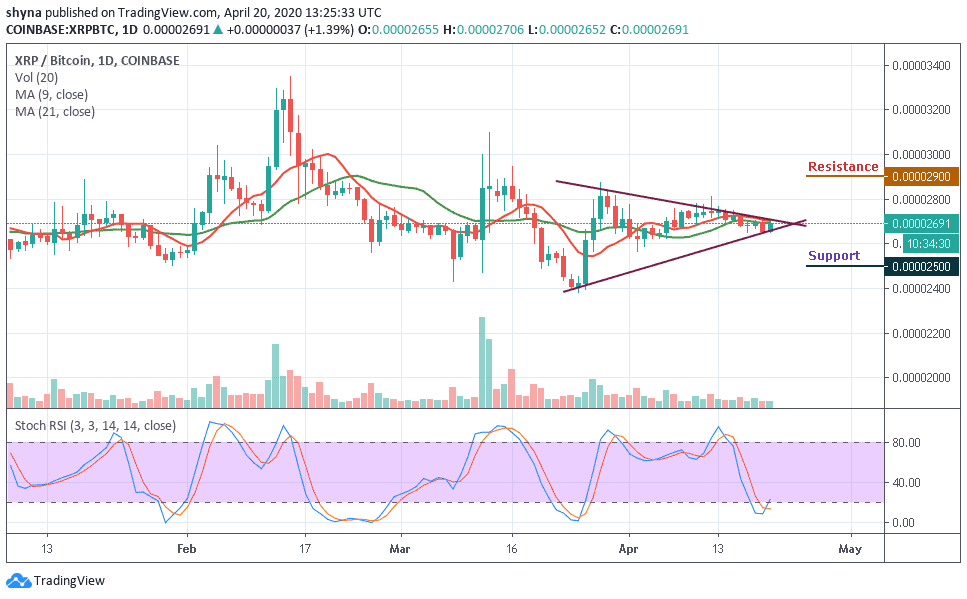
Moreover, if the bulls can break above 2800 SAT, further resistance is found at 2900 SAT and above but if the sellers push the price beneath the trend line of the symmetrical triangle, the next level of support is located at 2400 SAT, further support is found at 2500 SAT and below. The stochastic RSI is seen moving out of the oversold zone.
Please note: Insidebitcoins.com is not a financial advisor. Do your research before investing your funds in any financial asset or presented product or event. We are not responsible for your investing results.
Join Our Telegram channel to stay up to date on breaking news coverage
