Join Our Telegram channel to stay up to date on breaking news coverage
Key Highlights
- Ripple price failed to move above the $0.5620 resistance area and trimmed gains against the US dollar.
- There is a key connecting bullish trend line in place with support at $0.5250 on the hourly chart of the XRP/USD pair (data source from Kraken).
- The pair has to remain above the $0.5250 support area to avoid further losses in the near term.
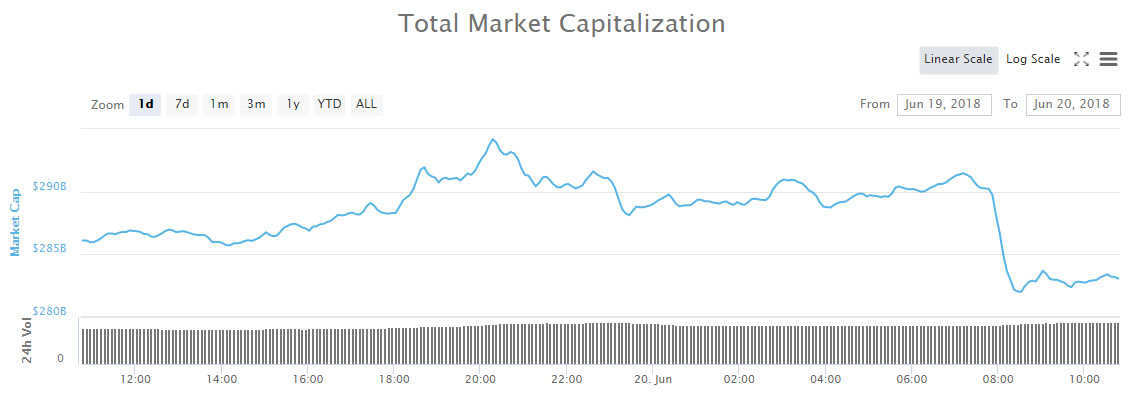
Ripple price struggled to hold gains against the US Dollar and Bitcoin. XRP/USD is currently moving lower and is testing a major support area near $0.5250.
Ripple Price Support
Yesterday, we saw a nice upside move above the $0.5400 level in Ripple price against the US Dollar. The price traded above the $0.5500 and $0.5600 resistance levels. However, the price failed to hold gains above $0.5600 and formed a high near $0.5620. A fresh downside move was initiated and the price declined below the $0.5400 level. There was also a break below the 50% Fib retracement level of the last wave from the $0.5100 low to $0.5616 high.
More importantly, the price broke the 100 hourly simple moving average to test the $0.5200 support. On the downside, there is a key connecting bullish trend line in place with support at $0.5250 on the hourly chart of the XRP/USD pair. The trend line support is close to the 61.8% Fib retracement level of the last wave from the $0.5100 low to $0.5616 high. If the price fails to hold the trend line and support at $0.5250, there may be more losses. The next support on the downside sits around the $0.5100 level.
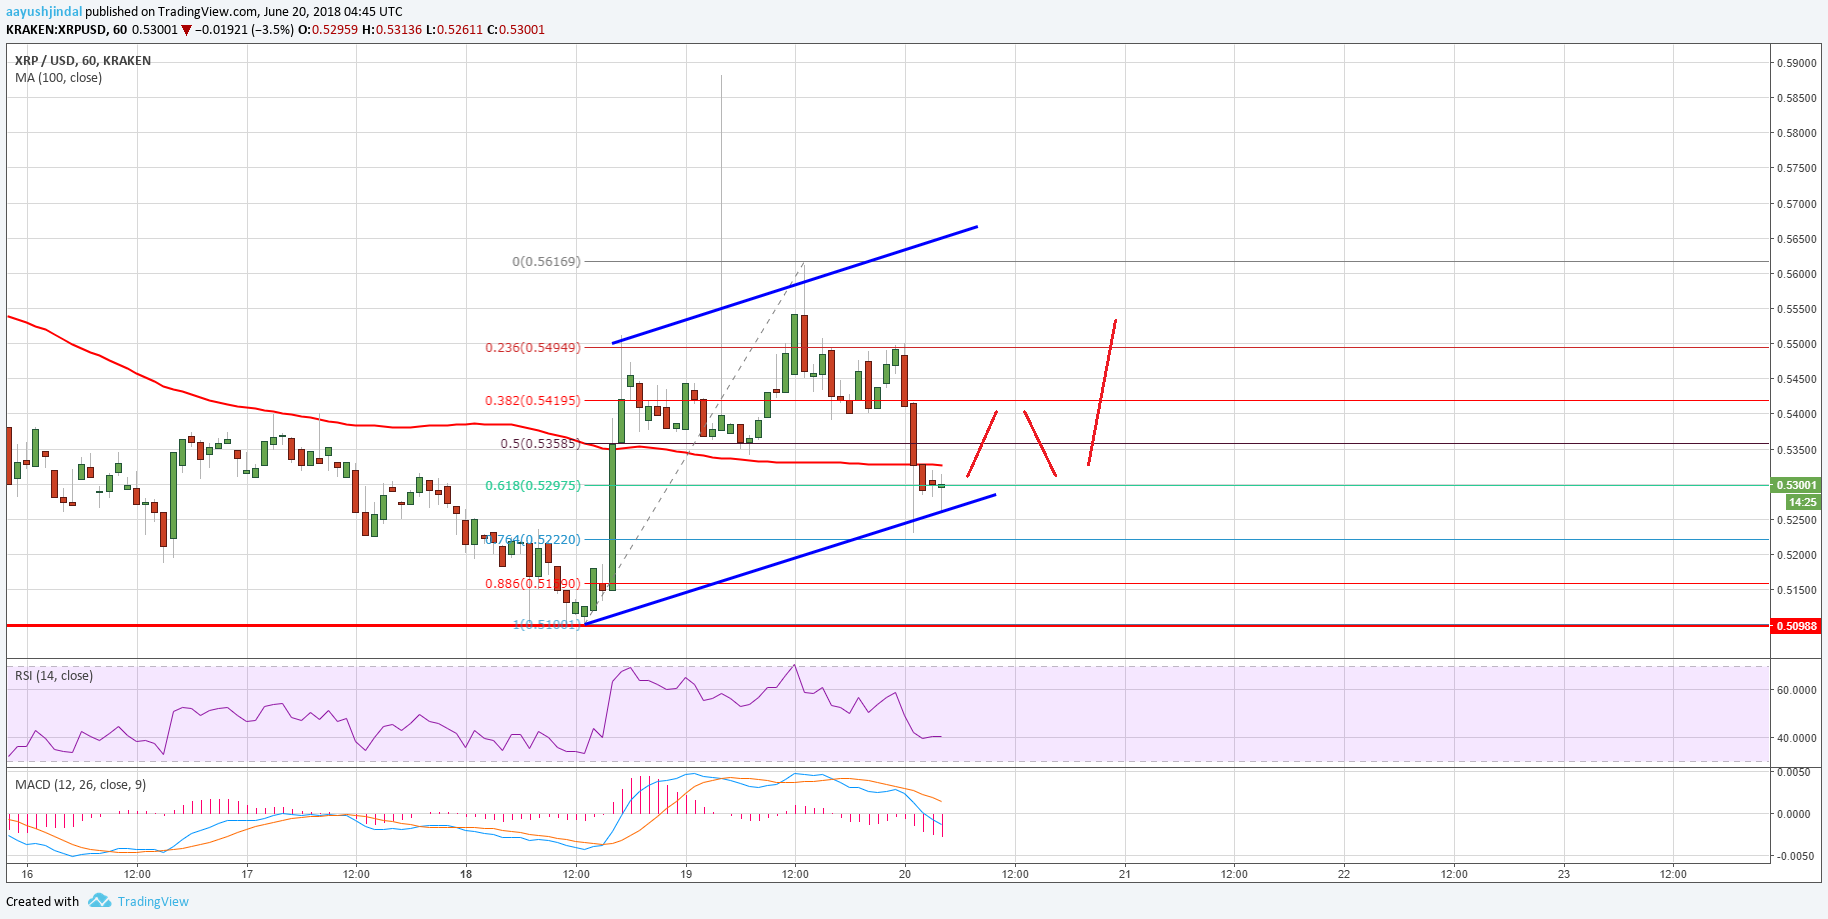
Looking at the chart, the price must stay above the $0.5250 support. On the upside, an initial resistance is at $0.5400, above which, the price may perhaps retest the $0.5600 resistance.
Looking at the technical indicators:
Hourly MACD – The MACD for XRP/USD has moved back in the bearish zone.
Hourly RSI (Relative Strength Index) – The RSI for XRP/USD is now well below the 50 level.
Major Support Level – $0.5250
Major Resistance Level – $0.5400
The post Ripple Price Analysis: Can XRP/USD Hold This Support? appeared first on NewsBTC.
Join Our Telegram channel to stay up to date on breaking news coverage