Join Our Telegram channel to stay up to date on breaking news coverage
In this forecast, we shall be looking at the new development in the XRP/USD and XRP/BTC markets. Generally speaking, both market under consideration appears to have gotten to the beginning of a downtrend. This is coming after this market has some upside gain, which was more pronounced in XRP/USD than in XRP/BTC.
Ripple Coin Forecast Statistics Data:
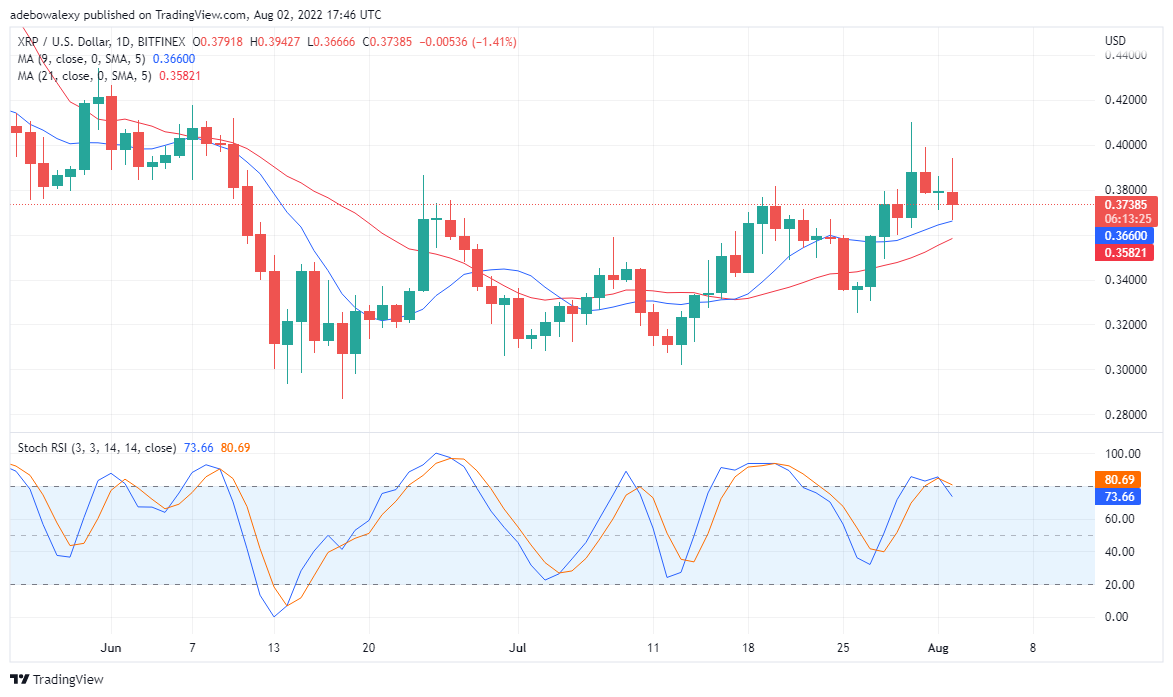
Ripple Coin’s price now: $0.3738
Ripple Coin’s market cap: $18 billion
Ripple Coin circulating supply: 99.9 billion
Ripple Coin’s total supply: 48.34 billion
Ripple Coin Coinmarketcap ranking: #6
Key Marks:
Top levels: $0.3738, $0.3800, $0.3900
Base levels: $0.3738, $0.3660, $0.3390
Going by signs portrayed by trading indicators, there isn’t much profit in this market for now. However let’s give this market a more critical consideration, by analyzing signs displayed on indicators.
Ripple Coin Price Forecast: XRP Price is Trending Downwards
On this daily XRP/USD it can be perceived that the value is trending downwards. Although the Moving Average threads are still below the price candlesticks there is no hope that the up trend will continue. This is because the Stochastic Relative Strength Indicator curves is portraying a strong downward movement that has begun. Furthermore, this is happening while the MA lines are below the price motion.
With this, even the Moving Average curves that are below price action will soon cross above it. Consequently, this will further portray the Ripple market condition. Eventually, lower support may be located around $0.3400, and maybe even lower.
Ripple Coin Price Forecast: XRP Price Trading Indicator Aligns to Portray an Undecided Market
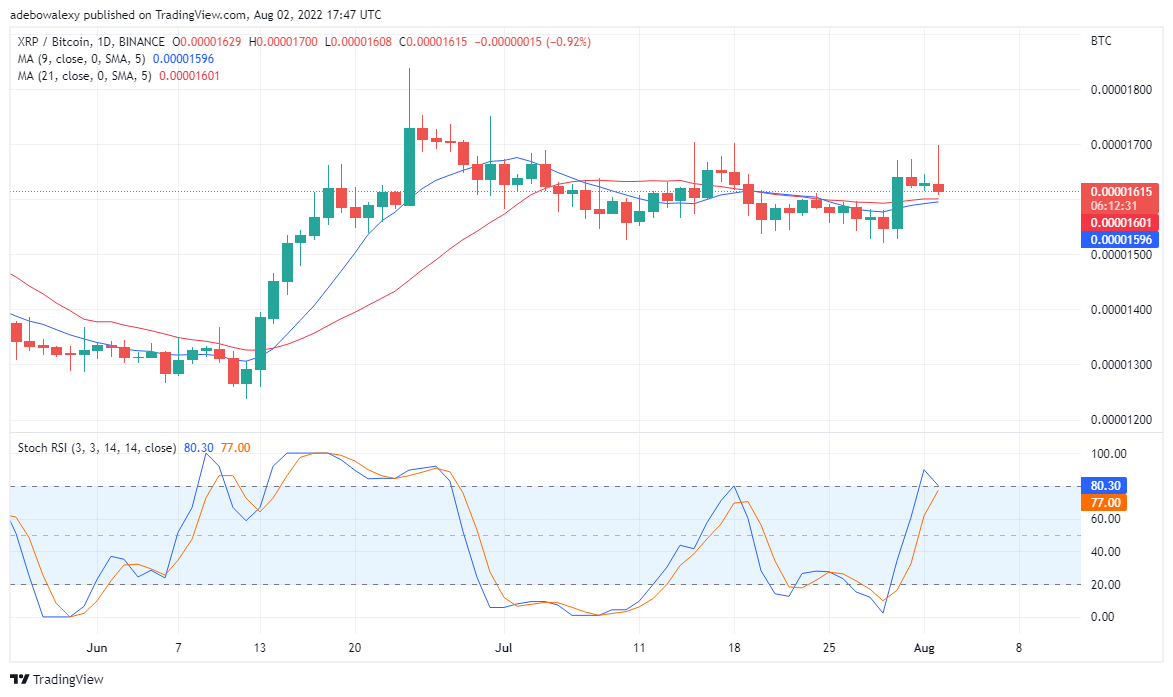
On the XRP/BTC daily chart, trading indicators appear to be in a consensus for a Downtrend. We can see that the MA lines which lie under the trading candlesticks are preparing to cross one another. Eventually, when it happens, the price of this crypto will either range or trend downwards. And, this is because the faster MA lines are likely to cross above the candlesticks. Also, the slower one is likely to follow. Eventually, the downtrend will continue.
Furthermore, the SRSI indicator threads are about to cross after reaching the overbought area. Consequently, this further confirms that Ripple will experience a downtrend of value in this market. Eventually, XRP/BTC will find lower support at $0.00001500 and below.
Join Our Telegram channel to stay up to date on breaking news coverage