Join Our Telegram channel to stay up to date on breaking news coverage
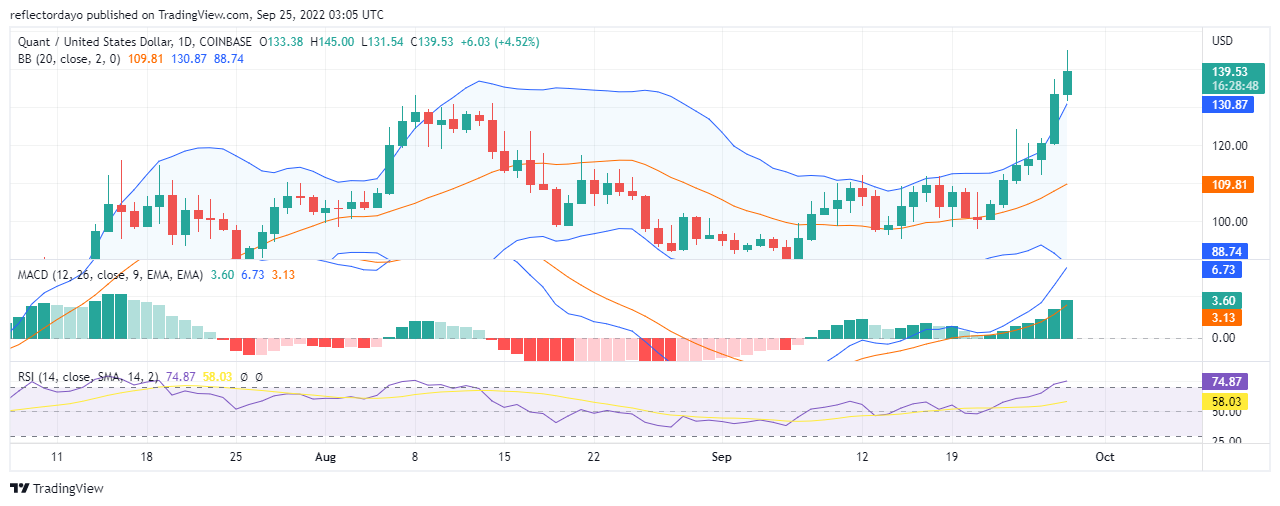
Between the 6th and 7th of September, the uptrend of QNT/USD began. It started after the market gave a significant candlestick pattern which is known as a bullish engulfing pattern. It formed at the support level of $89.81. From that 7th of September till date, we can see that the buying pressure is very strong. It is stronger than the selling pressure even though the struggle between the two market stakeholders makes the market very volatile. As the market continues to a higher level, it appears to be entering into the overbought and traders are already selling.
Quant Market Price Statistic:
- QNT/USD price now: $
- QNT/USD market cap: $
- QNT/USD circulating supply:
- QNT/USD total supply:
- QNT/USD coin market ranking: #
Key Levels
- Resistance: $ 140.00, $ 145.56, $150.00
- Support: $127.92, $124.00, $120.00
Your capital is at risk
Quant Market Price Analysis: The Indicators’ Point of View
The MACD line’s outlook portrays a very strong bullish move. But as the line moves far above the bullish histograms it enters into the overbought. And the price correction (or retracement) is already taking place. However, the RSI is just slightly into the overbought zone as it measures 75%. Looking at the bullish momentum of this market, it is very likely the trend continues after the retracement.
Quant: QNT/USD 4-Hour Chart Outlook
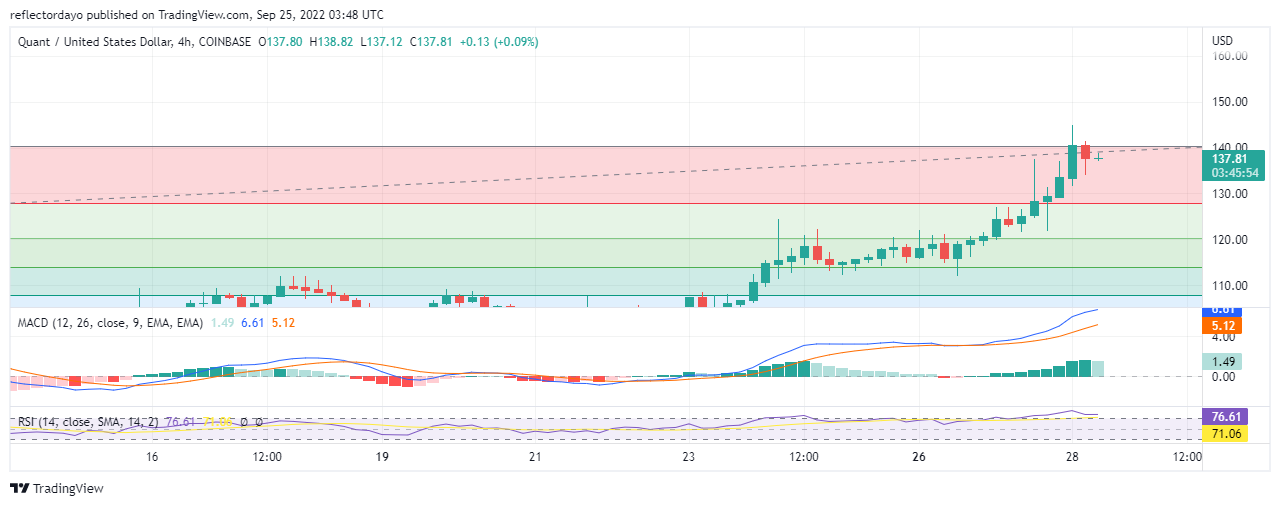
From this point of view, we can see that the price is pulling back for correction from the overbought. The RSI line has retraced to 75.8% from 83.06%. Although it is still in the overbought, at this point, it seems the market is fixed (unable to move) as demand struggles against supply. Some traders are selling after they have concluded that the price has reached its peak while some traders are still buying. However, in the MACD, the faded green histograms give us the sign that the bullish momentum is reducing. In addition to that, the height of the histogram is falling.
Join Our Telegram channel to stay up to date on breaking news coverage
