Join Our Telegram channel to stay up to date on breaking news coverage
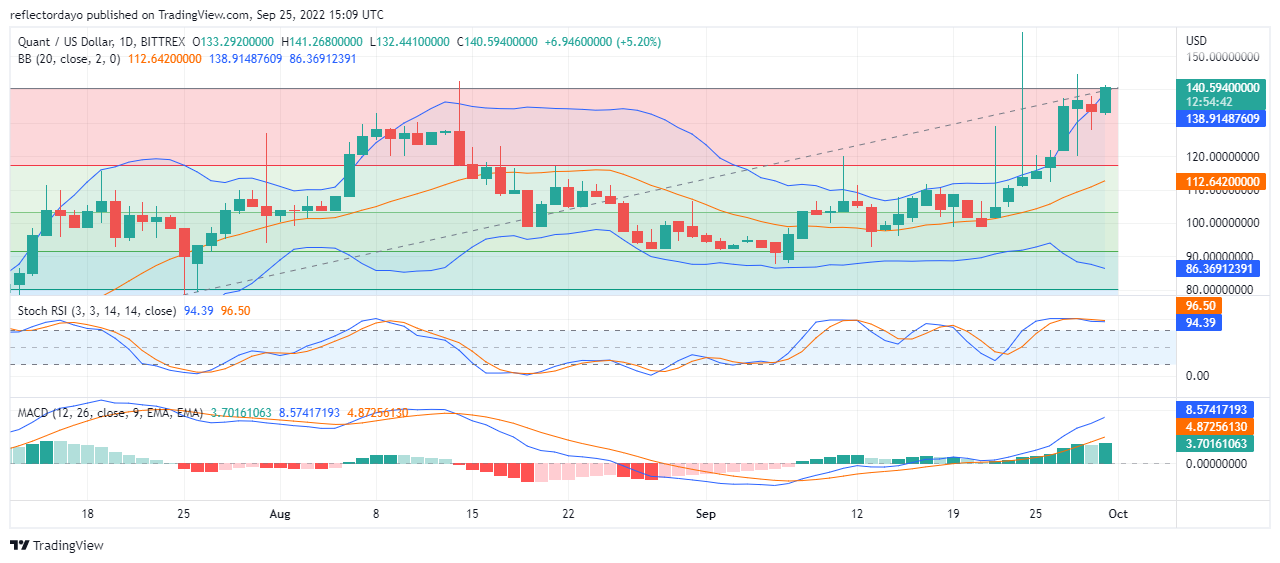
The uptrend of the Quant market is characterised by very bullish candlesticks. However, traders may think that a trend reversal will follow the market trend on the 22nd and 24th of September. This sentiment was proved wrong when the market continue to move on the upward side. After yesterday’s market went slightly in favour of the bears, today’s market is favouring the buyers and they have taken the price to $140.59400000.
Quant Market Price Statistic:
- QNT/USD price now: $140.59400000
- QNT/USD market cap: $1,672,565,172
- QNT/USD circulating supply: 12,072,738
- QNT/USD total supply: 14,612,493
- QNT/USD coin market ranking: #33
Key Levels
- Resistance: $145.0000, $150.0000, $155.00000
- Support: $120.00000, $115,0000, $110,00000
Your capital is at risk
Quant Market Price Analysis: The Indicators’ Point of View
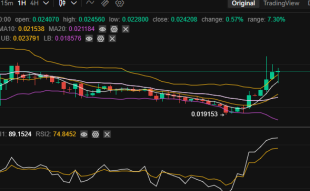
Bulls in this market are showing very strong aggression and this seems to trigger aggression in the bears as well. However, the buying pressure is more than the selling pressure. Even though this is true, the market may (in fact) be preparing to reverse the trend because indications show that the crypto is overbought. The RSI line is now showing signs of downward retracement. In confirmation of this, the price action is now moving back into the Bollinger band from the upper band region.
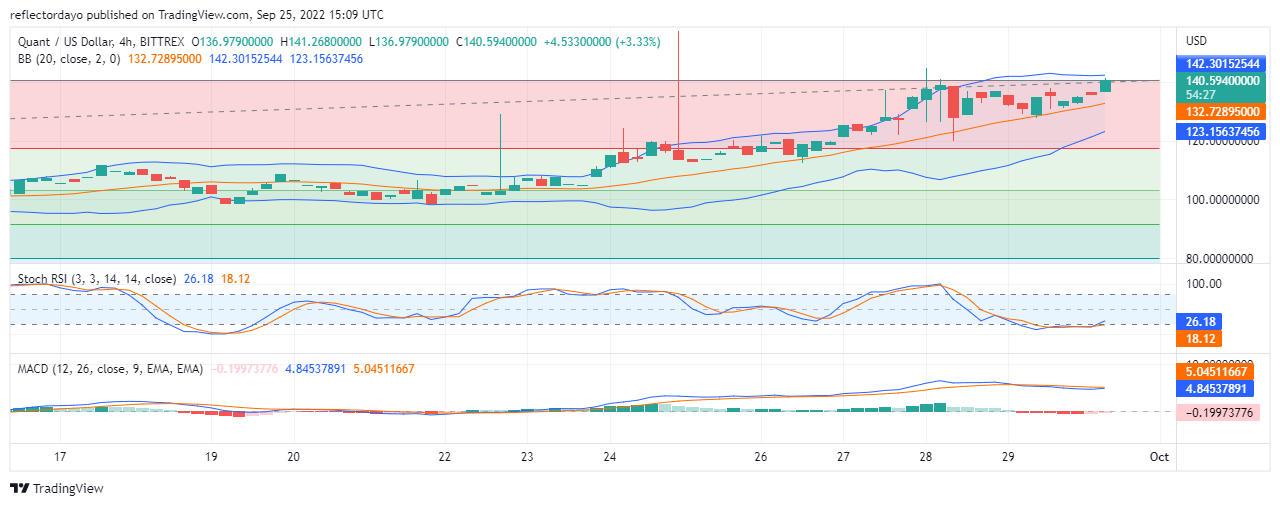
QNT/USD 4-Hour Chart Outlook
The buyers dominated the first session, the sellers took control of the second session and in the third session, they struggle to dominate the market. It looks like the sellers are becoming stronger. Usually, it is expected that traders will begin to sell as the price heats their expected height. The MACD histograms are now moving at the edge of the bearish market. But, Since the outlook of the buying pressure still looks strong (judging from the past performance) the uptrend market may continue after the price retracement.
Join Our Telegram channel to stay up to date on breaking news coverage
