Join Our Telegram channel to stay up to date on breaking news coverage
Polkadot Price Prediction – August 20
After a long range of northward movement, Polkadot now reverses southward, trading against the purchasing power of the US Dollar. The crypto market in the last thirty days’ sessions has witnessed a high of $6.55 and $9.62 value lines. As of the time of writing, the price is trading at $7.43 at an average percentage rate of 1.25 positive.
Polkadot (DOT) Statistics:
DOT price now – $7.43
DOT market cap – $8.2 billion
DOT circulating supply – 1.1 million
DOT total supply – 1.2 billion
Coinmarketcap ranking – #11
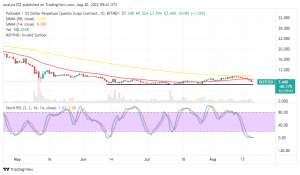
DOT/USD Market
Key Levels:
Resistance levels: $10, $12, $14
Support levels: $5, $4, $3 DOT/USD – Daily Chart
The daily chart showcases the Polkadot market reverses southward against the trade valuation of the US Dollar to break the trend line of the smaller SMA to the downside. The 14-day SMA indicator is at $8.30 below the $9.56 value line of the 50-day SMA indicator. The Stochastic Oscillators have dipped down into the oversold region, conjoining their lines tightly at 1.53 and 1.20 range points near the zero range line.
Your capital is at risk.
Will the DOT/USD market lowers further below the 14-day SMA trend line?
The Polkadot market operation can still go lowering further below the 14-day SMA trading indicator as the crypto economy reverses southward toward the baseline drawn around the $6 level. Buying activities may soon regain a stance while the price may have to come up with a bullish candlestick formation afterward against the current declining outlook. It has been indicated by the reading of the Stochastic Oscillators that price is on the verge of recuperating, awaiting an emergence of a day’s upswing to confirm the possibility of moving back northward.
On the downside of the technical analysis, downward-reversal motions have been taking place. For the market to move more downward, the DOT/USD market bears will need to exert forces by consolidating their presence maximally to touch the baseline around $6. While that assumption tends to achieve, new execution of selling activity will have to suspend for a while.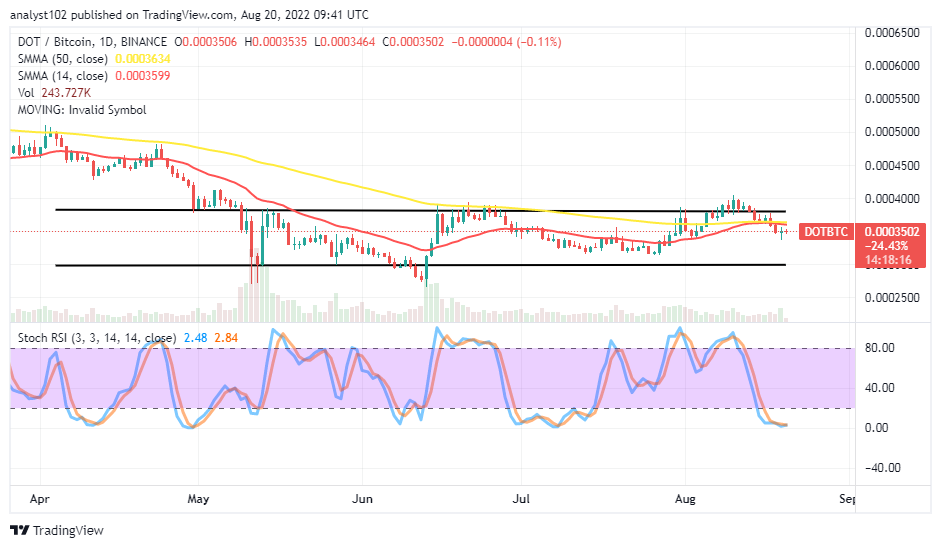
DOT/BTC Price Analysis
In comparison, Polkadot has been a bit lost in its striving efforts to push against the trending ability of Bitcoin lately. The cryptocurrency pair market reverses southward to position closely below the conjoined area of the trend lines of the SMAs. The 14-day SMA indicator has moved northward to join the 50-day SMA indicator at a higher spot within the range-bound zones. The Stochastic Oscillators have penetrated the oversold region. The base crypto may regain control of the trade pace against its counter crypto possibly after a while.
Read more:
Join Our Telegram channel to stay up to date on breaking news coverage