Join Our Telegram channel to stay up to date on breaking news coverage
The Polkadot price prediction is down at 1.47% at the time of writing as the coin goes below the opening price of $8.18.
Polkadot Prediction Statistics Data:
- Polkadot price now – $8.06
- Polkadot market cap – $8.9 billion
- Polkadot circulating supply – 1.1 billion
- Polkadot total supply – 1.2 billion
- Polkadot Coinmarketcap ranking – #11
DOT/USD Market
Key Levels:
Resistance levels: $11, $12, $13
Support levels: $6, $5, $4
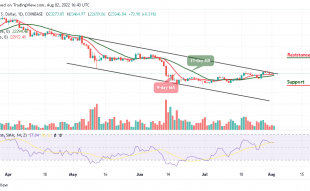
DOT/USD breaks below $8 after an unsuccessful attempt to settle above the upper boundary of the channel as the coin touches the daily low at $7.69. The Polkadot price is changing hands at $8.06, down 1.47%, and the bears have so far been keeping the market price at the negative side; hoping to touch the nearest support at $7.
Polkadot Price Prediction: Can Polkadot Price Spike Above $8?
The Polkadot price is currently heading to the south, but according to the daily chart, a break above the upper boundary of the channel could give the coin a boost towards the important resistance at $11, $12, and $13 levels. On the other hand, the technical indicator Relative Strength Index (14) has a bearish feel as the signal line moves to cross below the 60-level.
Meanwhile, if the coin dives and faces the lower boundary of the channel, the Polkadot price could create more downtrends. However, the market price may head to the downside if the technical indicator Relative Strength Index (14) slides and cross below the 50-level. On the other hand, the critical support levels could be found at $6, $5, and $4.
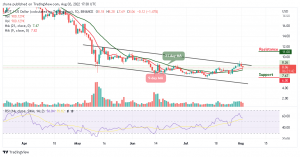
When compared with Bitcoin, the bears are making effort to step back into the market while the coin is showing some negative signs that could make lower lows if the price crosses below the 9-day and 21-day moving averages. On the downside, the nearest level of support lies at 2500 SAT and below.
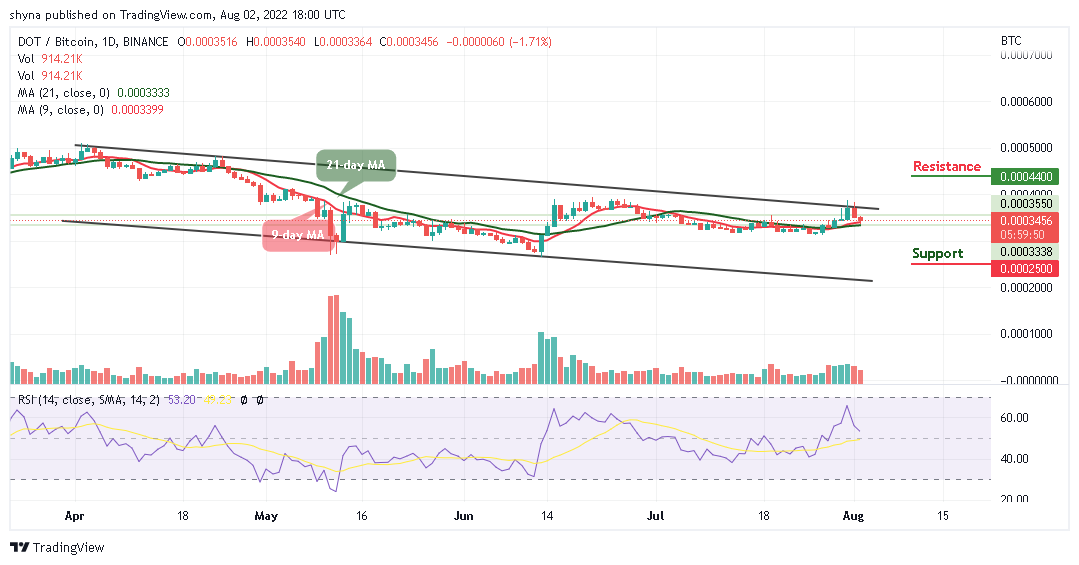
Looking from the upside, the nearest resistance level could be found above the upper boundary of the channel, above this, further resistance lies at 4400 SAT and above. The technical indicator Relative Strength Index (14) is likely to cross below the 50-level which indicates that more bearish signals may come to focus.
Read more:
Join Our Telegram channel to stay up to date on breaking news coverage