Join Our Telegram channel to stay up to date on breaking news coverage
The Polkadot price prediction shows DOT breaking towards the upper boundary of the channel as the eyes focus on the $9 level.
Polkadot Prediction Statistics Data:
- Polkadot price now – $8.6
- Polkadot market cap – $8.5 billion
- Polkadot circulating supply – 987.5 million
- Polkadot total supply – 1.1 billion
- Polkadot Coinmarketcap ranking – #11
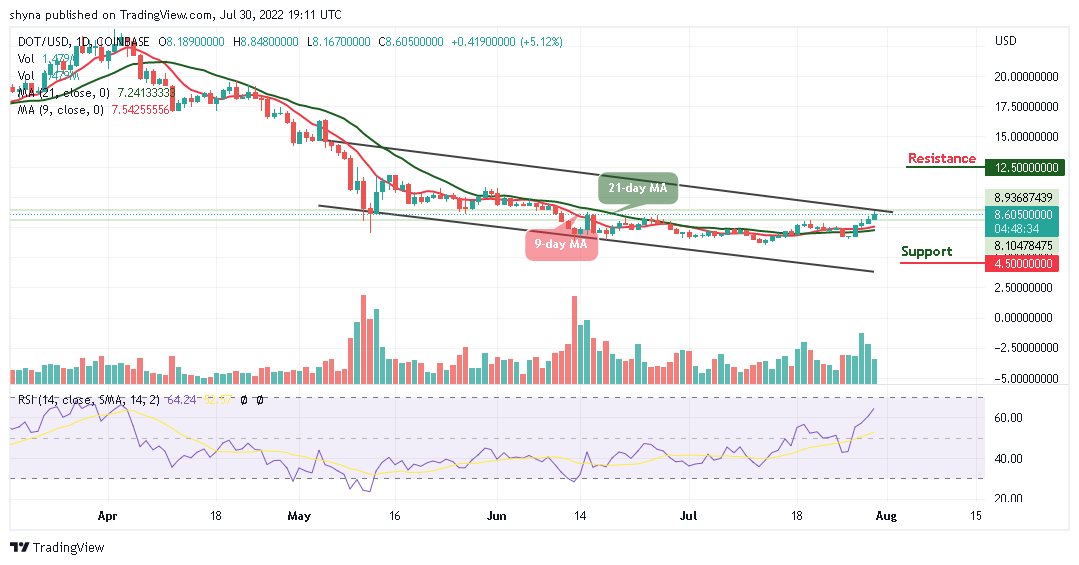
DOT/USD Market
Key Levels:
Resistance levels: $12.5, $13.5, $14.5
Support levels: $4.5, $3.5, $2.5
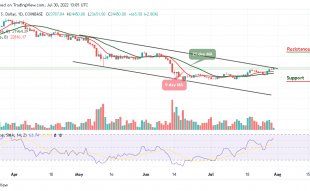
DOT/USD is refreshing to a new high after touching the daily low of $8.16 to breaches above $8.5 as the coin currently trades at $8.60 with a bullish crossover and trend intraday. Today, the crypto moves to cross above the upper boundary of the channel but higher support is expected at the $8 level.
Polkadot Price Prediction: Polkadot Price May Explode
The Polkadot price is struggling to cross above the channel as the technical indicator Relative Strength Index (14) remains above the 60-level, it’s likely for the coin to experience some bullish signals, which can finally encourage more buyers to enter the market.
However, if the 9-day moving average stays above the 21-day moving average, the coin may cross above the channel, and the price could hit the resistance levels at $12.5, $13.5, and $14.5 respectively. More so, if the technical indicator decides to make a quick turn and face the downside, there may be a quick bearish drop which may likely hit the support levels of $4.5, $3.5, and $2.5.
When compared with Bitcoin, Polkadot is trading above the 9-day and 21-day moving averages as the price touches the resistance level of 3701 SAT. However, the fact that the market remains in the descending channel, seems to be moving towards the upper boundary of the channel.
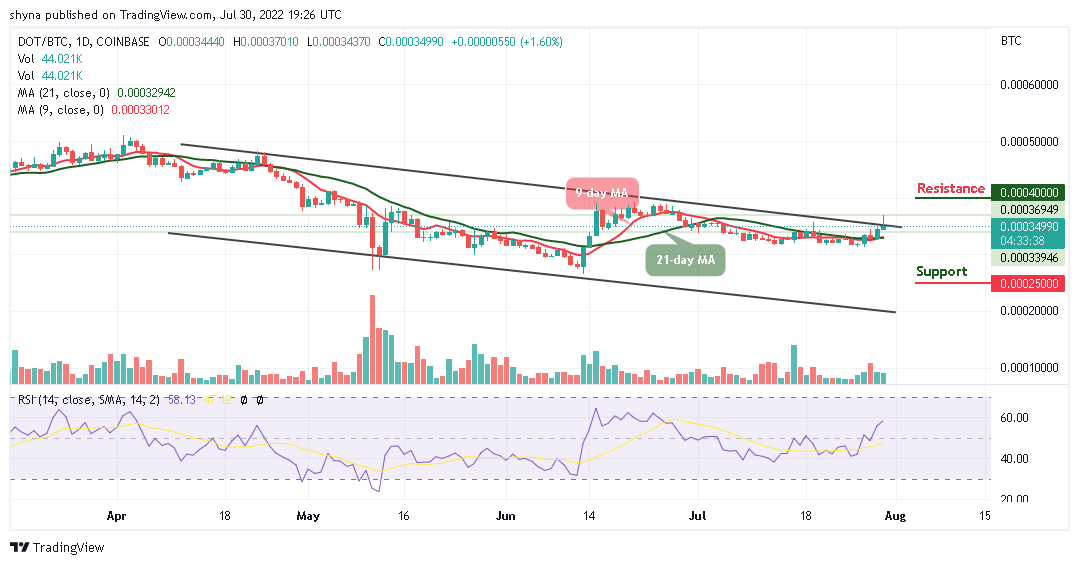
Moreover, if the buyers push the market price above the channel, DOT/BTC may touch the resistance level of 4000 SAT and above. On the contrary, higher selling pressure may cancel the bullish pattern, and this could attract new sellers coming into the market with the next support level at 2500 SAT and below, but the technical indicator Relative Strength Index (14) moves to cross above the 60-level.
Read more:
Join Our Telegram channel to stay up to date on breaking news coverage