Join Our Telegram channel to stay up to date on breaking news coverage
The Bitcoin price prediction shoots above $24,000 as bulls are ready to blow hot doing a little to flip the market sentiment at this stage.
Bitcoin Prediction Statistics Data:
- Bitcoin price now – $24,450
- Bitcoin market cap – $466.5 billion
- Bitcoin circulating supply – 19.1 billion
- Bitcoin total supply – 19.1 billion
- Bitcoin Coinmarketcap ranking – #1
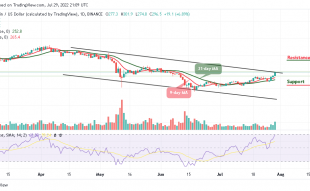
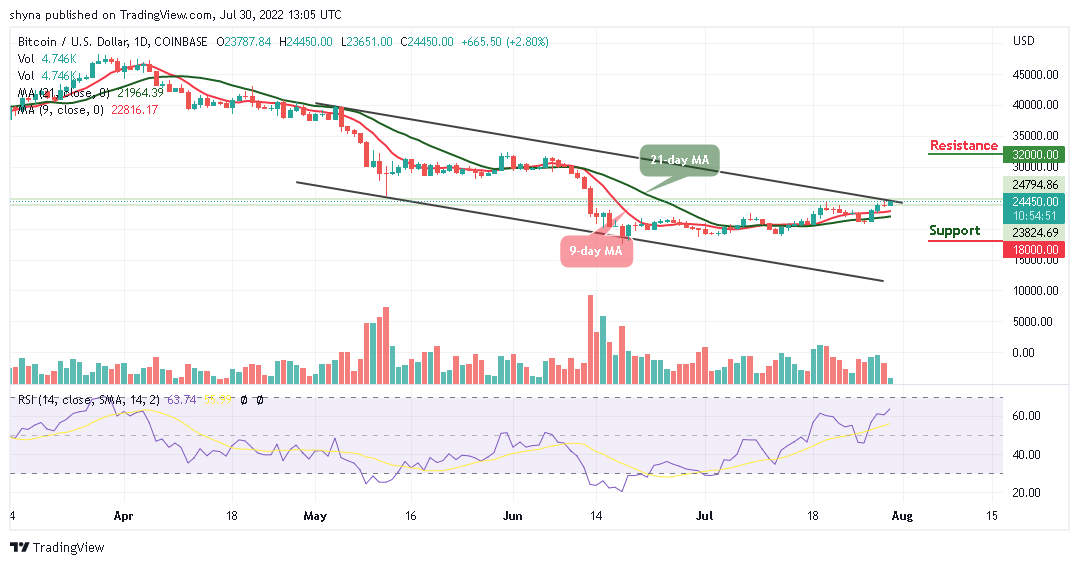
BTC/USD Long-term Trend: Ranging (Daily Chart)
Key levels:
Resistance Levels: $32,000, $34,000, $36,000
Support Levels: $18,000, $16,000, $14,000
BTC/USD keeps following the bullish movement, and it is likely to start a new trend as the 9-day moving average remains above the 21-day moving average. At the beginning of today’s trading, the Bitcoin price touches the low of $23,651 as it is currently trading at $24,450 and it is likely to settle above the upper boundary of the channel in the next positive direction.
Bitcoin Price Prediction: BTC Price Ready to Cross Above the Channel
The Bitcoin price is retracing above the 9-day and 21-day moving averages as the market price prepares to cross to a higher level. In the meantime, any further bullish movement may increase the price above the upper boundary of the channel. Meanwhile, another resistance may come at $26,000 before reaching the potential resistance of $32,000, $34,000, and $36,000 levels.
However, if the resistance level of $25,000 failed to hold, it may reverse and face the support level of $23,000 as a further increase in the bears’ pressure may bring down the price below the 21-day moving average, and this could cause the king coin to hit the supports at $18,000, $16,000, and $14,000. In the meantime, the technical indicator Relative Strength Index (14) stays above the 60-level to increase the bullish movement.
BTC/USD Medium-term Trend: Bullish (4H Chart)
The Bitcoin price is hovering above the 9-day and 21-day moving averages at a price value of $24,561. With the look of things, the bulls may keep the Bitcoin price above the moving averages but any bearish cross below this barrier may bring the coin towards the support level of $23,000 and below.
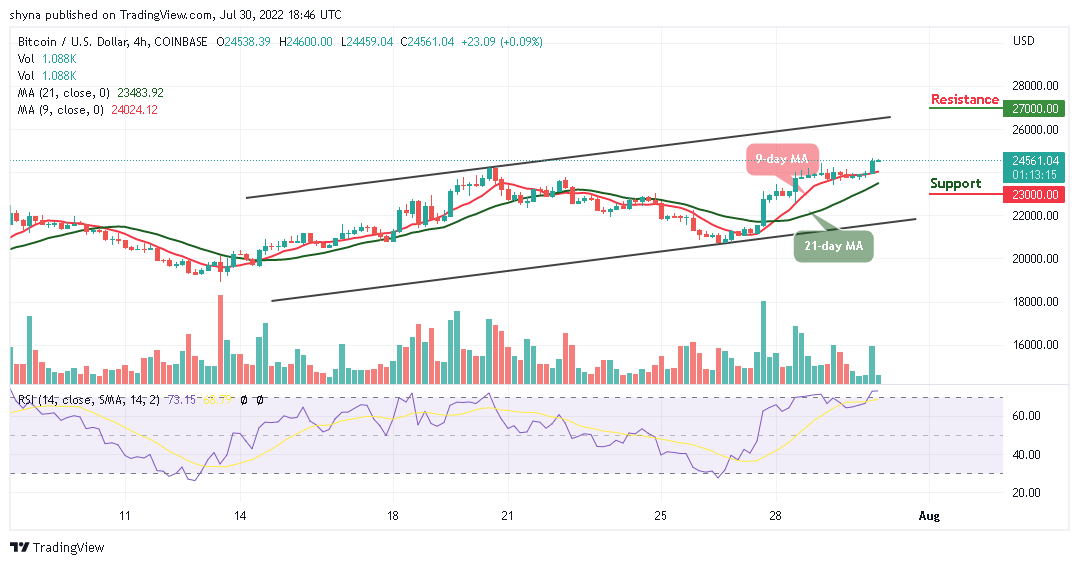
Moreover, if the Bitcoin price finds a decent resistance level at $25,000 level, the first digital asset may continue the bullish movement towards the upper boundary of the channel which may likely hit the resistance level of $27,000 and above. However, the technical indicator Relative Strength Index (14) moves into the overbought region, suggesting additional bullish signals in the market.
Read more:
- How to buy Bitcoin
- How to buy Cryptocurrency
Join Our Telegram channel to stay up to date on breaking news coverage