Join Our Telegram channel to stay up to date on breaking news coverage
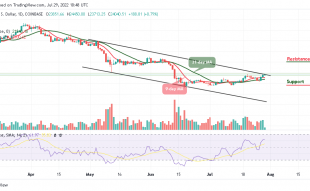
The Binance coin price prediction shows that BNB is likely to cross above the upper boundary of the channel as the coin shoots to the upside.
Binance Coin Prediction Statistics Data:
- Binance Coin price now – $296.5
- Binance Coin market cap – $47.5 billion
- Binance Coin circulating supply – 161.3 million
- Binance Coin total supply – 161.3 million
- Binance Coin Coinmarketcap ranking – #5
BNB/USD Market
Key Levels:
Resistance levels: $370, $390, $410
Support levels: $220, $200, $180
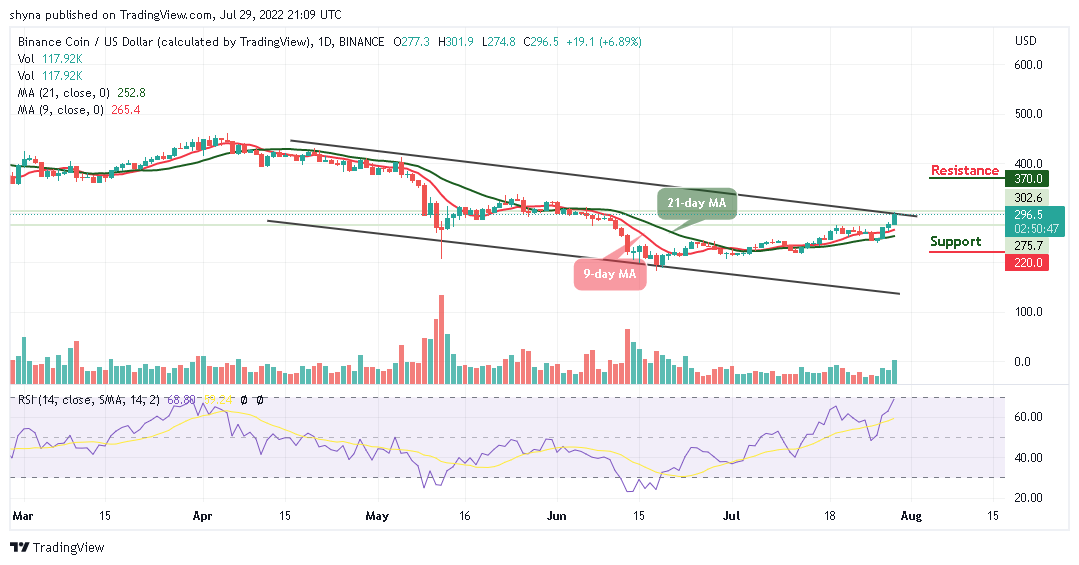
BNB/USD is currently trading at $296.5 after touching the daily low of $274.8 and it is likely to climb above the upper boundary of the channel. However, in case the buyers were able to push the price above the resistance level of $300 this time, the daily candlestick may close above this level, and the price could rally towards the resistance level of $350.
Binance Coin Price Prediction: Binance Coin Gets Ready for the Upside
According to the daily chart, the Binance price is moving close to the resistance level of $350 as the coin prepares to create an additional gain. The technical indicator Relative Strength Index (14) is also moving to cross into the overbought region with the signal line pointing up to indicate a buy signal.
Nevertheless, if the buyers were able to push the price above the channel, the Binance Coin price may spike to hit the potential resistance levels of $370, $390, and $410 while crossing below the 9-day and 21-day moving averages may bring the coin to the supports at $220, $200, and $180 respectively.
BNB/BTC Market: Price Moves to the Upside
When compared with Bitcoin, the Binance coin is following a bullish surge, and it may swing high to cross above the upper boundary of the channel which could locate the resistance level of 1300 SAT and above. On the other hand, if the market price crosses below the 9-day and 21-day moving averages, it could reach the support level of 1100 SAT and below.
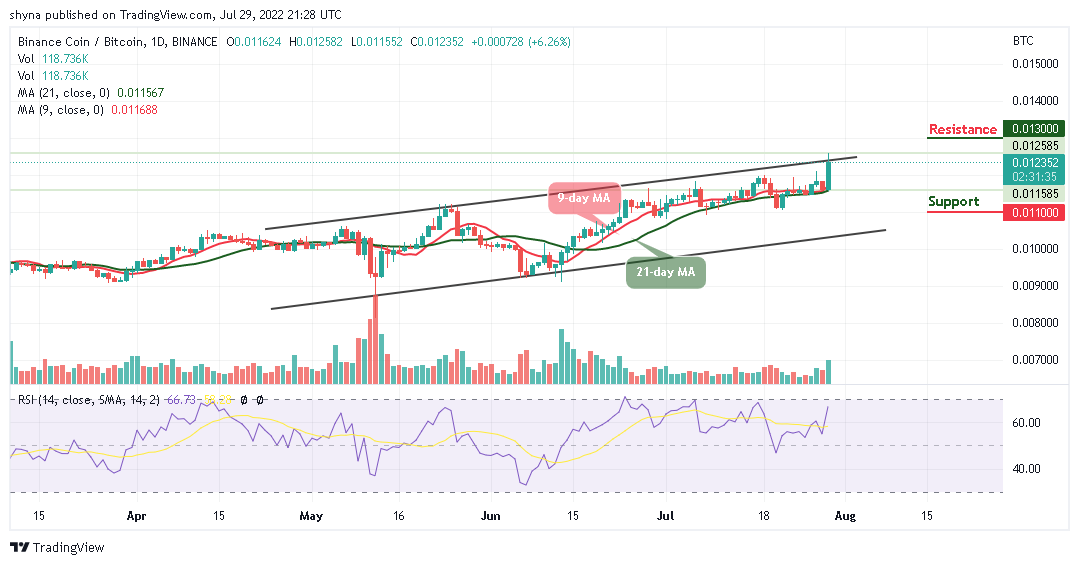
However, the technical indicator Relative Strength Index (14) is currently moving to cross into the overbought region as the signal line points to the north to confirm the bullish movement. Moreover, any further bullish movement may create additional gains above the channel.
Read more:
- How to buy Binance Coin
Join Our Telegram channel to stay up to date on breaking news coverage