Join Our Telegram channel to stay up to date on breaking news coverage
The Polkadot price prediction shows that DOT may settle above the upper boundary of the channel as the coin heads to the upside.
Polkadot Prediction Statistics Data:
- Polkadot price now – $9.52
- Polkadot market cap – $10.5 billion
- Polkadot circulating supply – 1.1 billion
- Polkadot total supply – 1.2 billion
- Polkadot Coinmarketcap ranking – #10
DOT/USD Market
Key Levels:
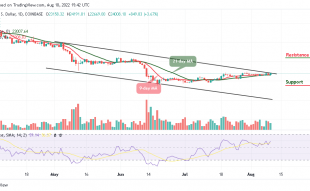
Resistance levels: $12, $13, $14
Support levels: $7, $6, $5
Looking at the daily chart, DOT/USD is attempting to cross above the upper boundary of the channel. The cryptocurrency is now trying to create a higher ground above the resistance level of $9.5, and should the buyers keep the coin above the moving averages, it may remain on the upside.
Polkadot Price Prediction: Polkadot May Gain More Uptrends
The Polkadot price is currently above the 9-day and 21-day moving averages, if the resistance of $10 gives way, the bull run may come to focus, and the coin might create an additional bullish trend. Now, the bullish scenario seems to surface as buyers continue to post firm commitments into the market. Therefore, if the coin reaches the resistance level of $11, this could further strengthen the market to $12, $13, and $14 resistance levels.
On the downside, a lower possible swing may likely retest the previous support if the coin crosses below the moving averages. However, if the bears manage to fuel the market, traders may expect a further drop to the support levels of $7, $6, and $5 respectively. On the other hand, the technical indicator Relative Strength Index (14) is now moving towards the 70-level, indicating that the market can continue with the bullish trend.
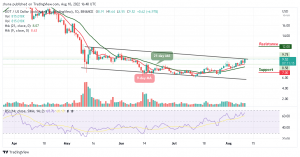
Compared with Bitcoin, the Polkadot price remains above the moving averages in other to touch the resistance level of 4000 SAT. However, this resistance level is expected to effectively exceed so that the market price may end up closing above it.
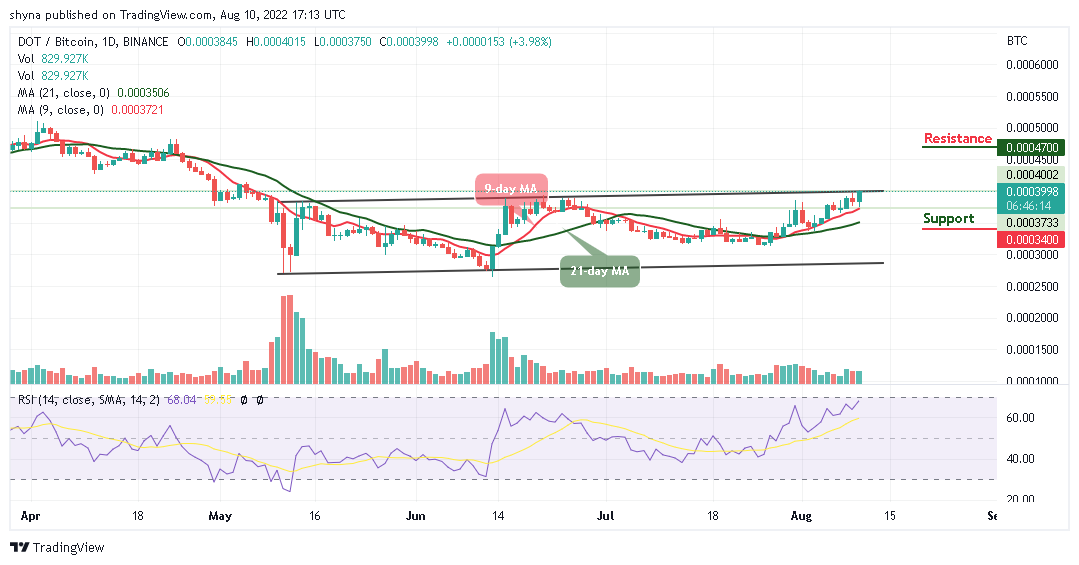
On the other hand, if DOT/BTC trades below the 9-day and 21-day moving averages, it could refresh lows under 3700 SAT and a possible bearish continuation may likely meet the major support at 3400 SAT and below. However, if the coin crosses above the upper boundary of the channel, DOTB/BTC could hit the potential resistance at 4700 SAT and above as the technical indicator Relative Strength Index (14) is moving to cross above the 70-level.
Read more:
Join Our Telegram channel to stay up to date on breaking news coverage