Join Our Telegram channel to stay up to date on breaking news coverage
The Bitcoin price prediction shows that BTC touches the resistance level of $24,191 as the coin prepares for another upward movement.
Bitcoin Prediction Statistics Data:
- Bitcoin price now – $24,002
- Bitcoin market cap – $459 billion
- Bitcoin circulating supply – 19.1 million
- Bitcoin total supply – 19.1 million
- Bitcoin Coinmarketcap ranking – #1
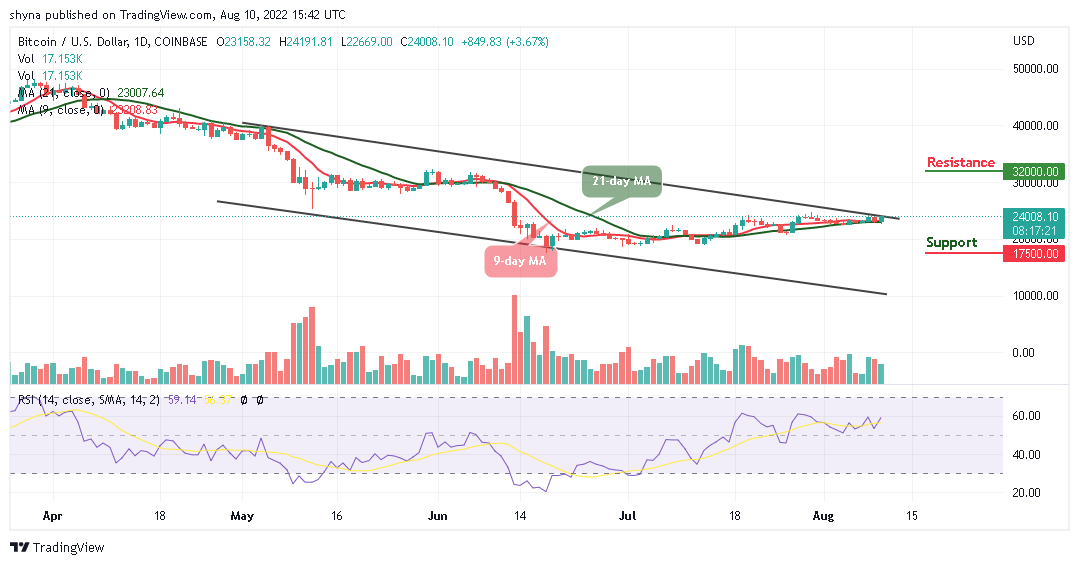
BTC/USD Long-term Trend: Ranging (Daily Chart)
Key levels:
Resistance Levels: $32,000, $34,000, $36,000
Support Levels: $17,500, $15,500, $13,500
BTC/USD is trading above the 9-day and 21-day moving averages at $24,008 as the coin prepares to gain additional bullish movement. Today, the first digital asset is likely to extend above the upper boundary of the channel which could make the price hit the nearest resistance level of $25,000 should the bulls put more pressure on the market.
Bitcoin Price Prediction: Is $25k Resistance Coming for BTC?
At the time of writing, the Bitcoin price is hovering above the 9-day and 21-day moving averages, any further bullish movement above the $25,000 resistance level may locate the potential resistance levels at $32,000, $34,000, and $36,000. However, when the new uptrends are gathering, traders may use the moving averages as a pivot resistance point to gauge the strength of the trend. Therefore, if BTC/USD soars above the channel, this could be a sign of sustainability and could result in a bullish continuation.
On the contrary, if the BTC price fails to move up; traders may see a price cut towards the lower boundary of the channel, and a further low could bring the price to the support levels at $17,500, $15,500, and $13,500 respectively. As it stands now, the Bitcoin price is likely to rise as the technical indicator Relative Strength Index (14) moves to cross above the 60-level.
BTC/USD Medium-term Trend: Ranging (4H Chart)
According to the 4-hour chart, the Bitcoin price is heading to the north as the bulls are stepping back into the market by keeping the coin above the 9-day and 21-day moving averages. However, If BTC/USD slides to the downside, the support level of $22,000 and below may come into focus.
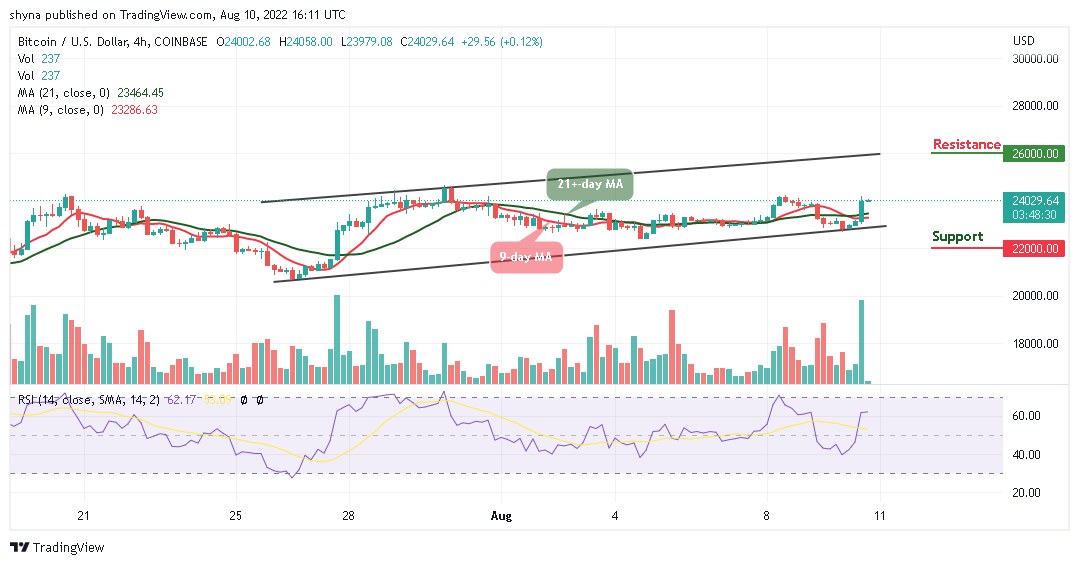
Nevertheless, if the bulls keep the market above the moving averages, traders may expect a touch of the $25,000 resistance level, and breaking this level may further push the price towards the resistance level of $26,000 and above as the technical indicator Relative Strength Index (14) stays above 60-level, suggesting bullish movement.
Read more:
Join Our Telegram channel to stay up to date on breaking news coverage