Join Our Telegram channel to stay up to date on breaking news coverage
PAX Gold price shattered a key barrier on December 27, confirming a highly bullish technical setup. The price then rose approximately 9% to highs of $1,889, levels last seen in April. before correcting to the current levels. The recent correction was a result of investors taking profits on the rally to $1,920, but this may be short-lived as it provided an opportunity to buy PAXG at a discount driving the ongoing recovery.
PAX Gold Price Must Hold Above The 50 SMA
The PAX Gold price was trading above an inverse head-and-shoulders chart pattern; the technical formation was confirmed in late December. This signaled the beginning of a bullish breakout as shown on the daily chart below. This happened once the price closed above the governing chart pattern’s neckline at $1,798.
At press time, the PAXG token was trading at $1,867, a level embraced by the 50-day Simple Moving Average (SMA) after being rejected by the $1,920 psychological level over the weekend. The PAXG bulls are currently driving a recovery that would see the price grow and reach the technical target of the inverse H&S set up at $1,991. Such a move would represent a 6.5% uptick from the current price.
For this to happen, the bulls must ensure a daily candlestick close above the 50-day SMA (yellow line) which is the immediate support. If this happens, it would suggest that the buyers are aggressively defending this support zone.
Note that the price has not slipped below this dynamic support since November 4 November, just before the FTX fiasco sent crypto prices tumbling. PAX Gold went on to rally 11.5% toward the neckline. Therefore, this is a crucial defense line for PAXG that it must hold to avoid further losses.
PAXG/USD Daily Chart
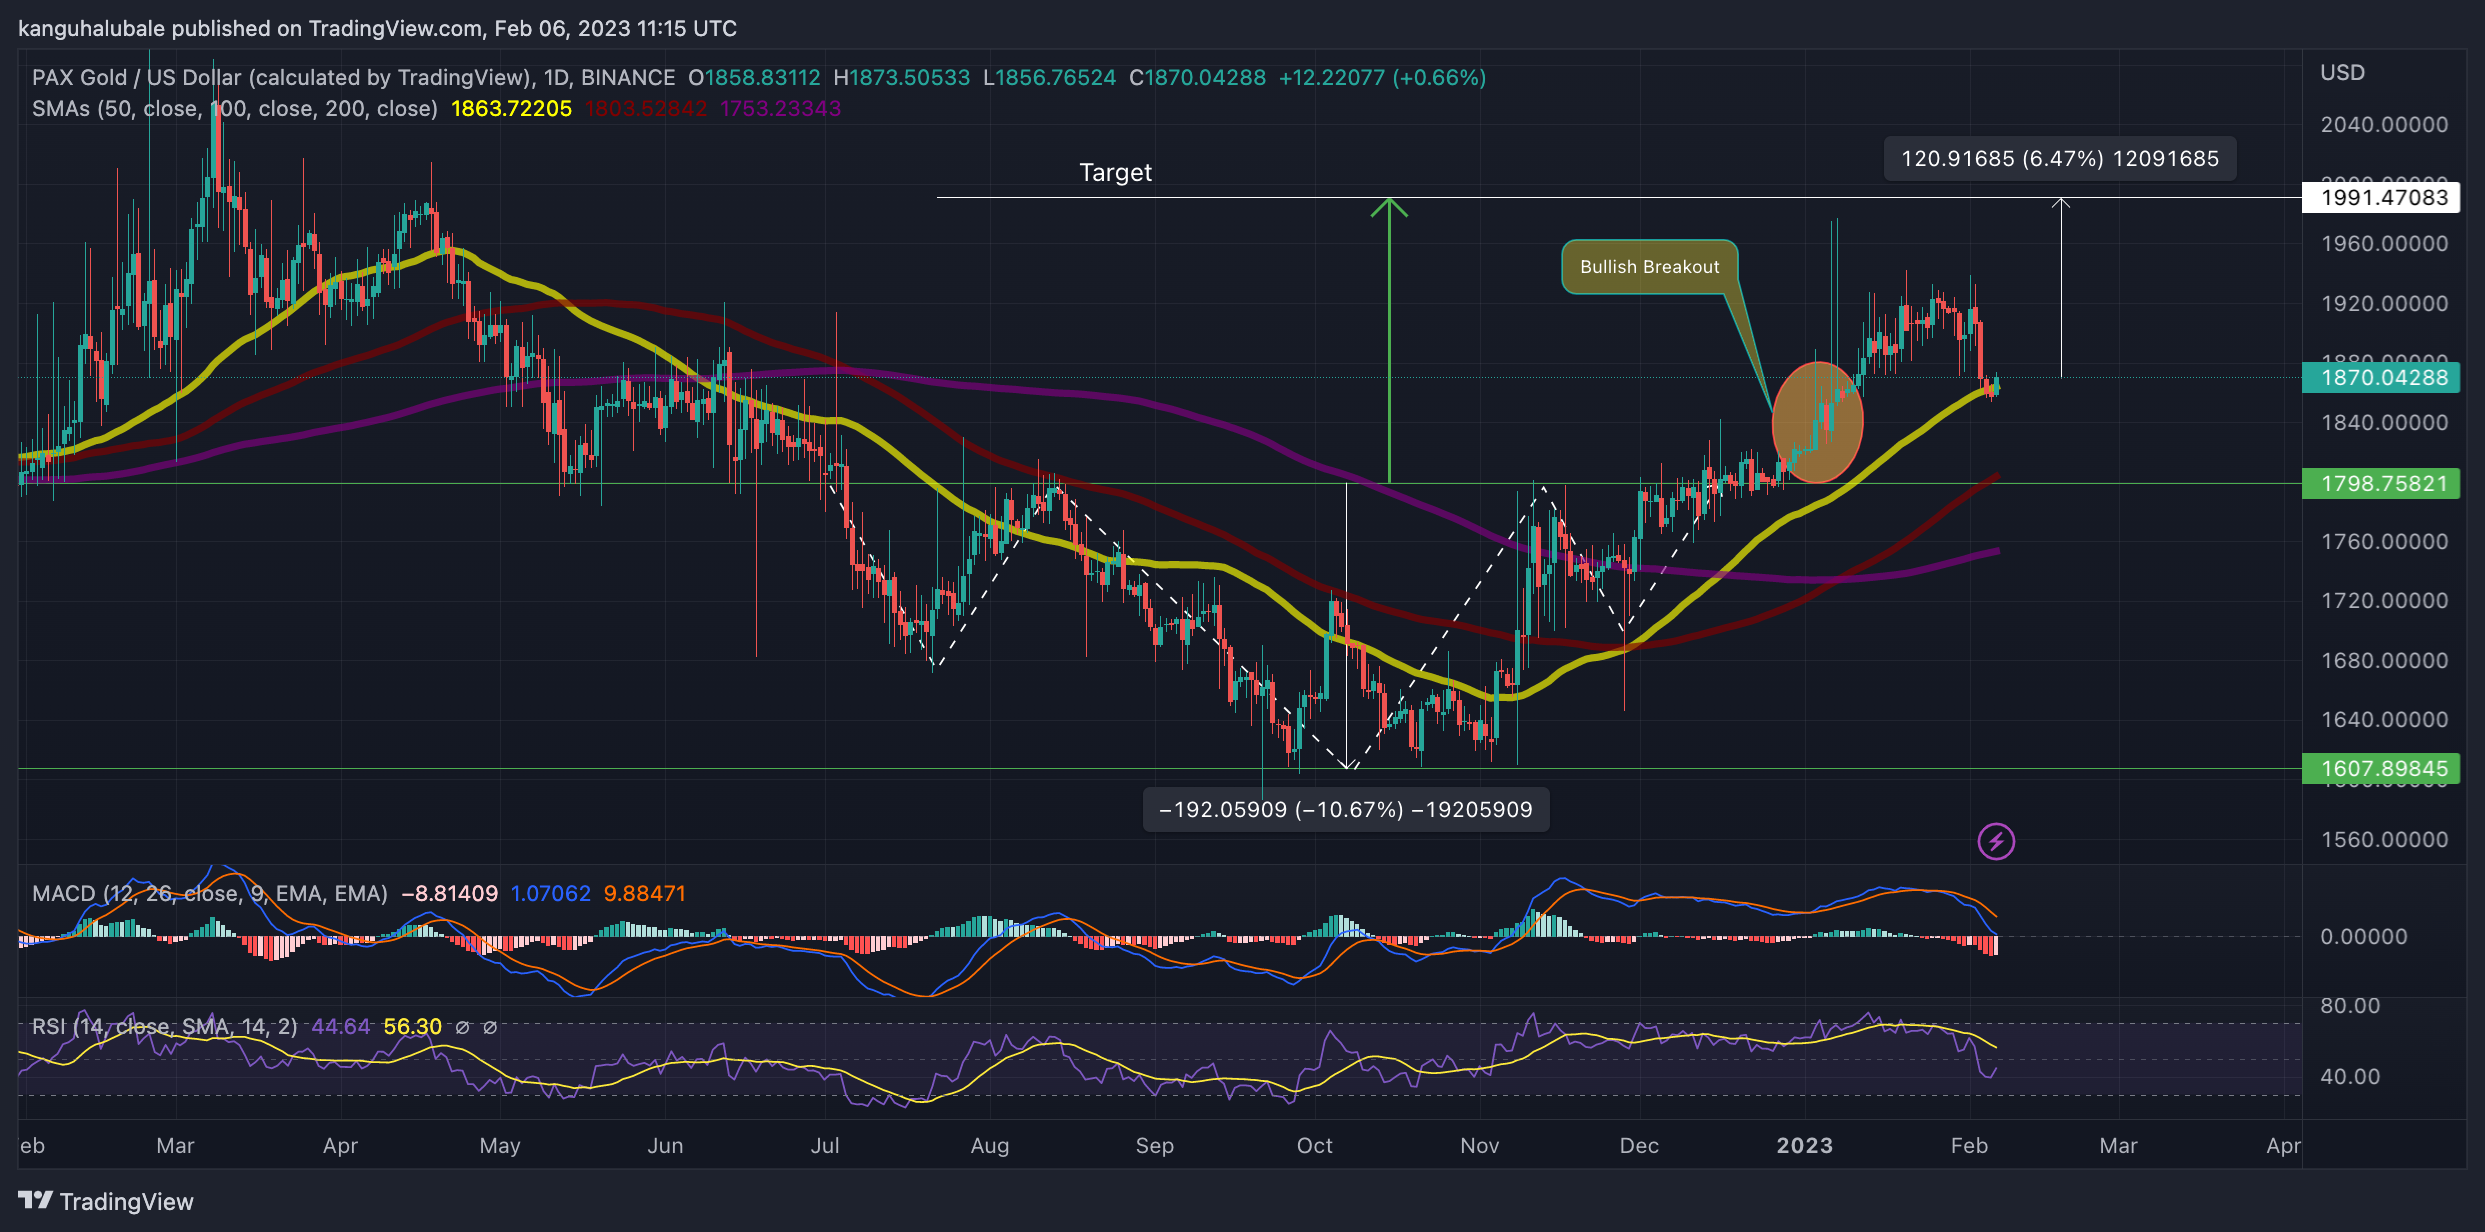
Apart from the technical formation, other indicators validated PAX Gold’s bullish thesis. To begin with, the price is sitting on strong support provided by the major moving averages: the 50-day SMA at $1,863, the 100-day SMA at $1,803, and the 200-day SMA at $1,753. These provide robust breathing areas where buyers can regroup on the downside before making another attempt at recovery.
In addition, the moving average divergence convergence (MACD) indicator was still positioned above the zero line in the positive region. This suggested that the PAX Gold market was still slightly bullish.
Moreover, the relative strength index (RSI) was moving upward toward the midline. This suggests that more buyers were entering the market at lower levels, adding credence to the positive narrative
Conversely, the MACD was moving downward and was about to cross the neutral line into the negative region. The call to sell PAXG, which was sent on 23 January when the 12-day exponential moving average (EMA) (blue line) crossed below the 26-day EMA line (orange), was still intact, an indication that the price may drop further.
As Such, there could be a pullback below the 50-day SMA with the PAX Gold price dropping first toward the inverse H&S neckline at $1,798, embraced by the 100-day SMA, and later to the 200-day SMA at $1,753. In highly desperate scenarios, the buyers may retreat lower toward the tip of the right shoulder at $1,690, completely invalidating the bullish narrative.
Promising Alternatives To PAXG
The technical analysis above forecasted a possible rise with up to 6% gains in the near term. This will only happen if bulls hold the price above the 50-day SMA and remain focused on reaching the inverse H&S chart pattern’s target. However, there are other options to explore for those aiming to invest in something more promising.
The number of new projects and new cryptocurrencies in presale is increasing every day. For example, C+Charge (CCHG) is a new ecosystem that is changing the electric vehicle (EV) charging industry. For the first time, drivers of EVs will gain access to the carbon credit industry, which has been dominated by big corporations like Tesla and BMW.
Users are rewarded with carbon credits for paying with CCHG at selected charging stations.
📱 Are you looking for innovative payment methods for your EV charge?
C+Charge allows users to connect their digital wallet for quick and transparent transactions ⚡️
Join our presale and buy some $CCHG before it's gone ⬇️https://t.co/ixe18bPqzI pic.twitter.com/Mkl9d5BCv2
— C+Charge (@C_Charge_Token) February 5, 2023
Moreover, holders of CCHG will also earn carbon credits through reflections. The team is building an all-around application to provide drivers with real-time data about charging stations, wait times, and payment options, among other features.
So far, the team behind C+Charge gas raised $695k in presale, where 1 CCHG is $0.013. Only 106 million tokens are left before the price increases to $0.0165.
Visit C+Charge here for more information on how to participate in the presale.
Related News:
- Biggest Crypto Gainers Today February 5 – SHIB, GRT, MEMAG, FGHT, CCHG, TARO
- C+Charge Presale Review – Green Crypto & NFT Project
- How To Buy C+Charge
Best Wallet - Diversify Your Crypto Portfolio

- Easy to Use, Feature-Driven Crypto Wallet
- Get Early Access to Upcoming Token ICOs
- Multi-Chain, Multi-Wallet, Non-Custodial
- Now On App Store, Google Play
- Stake To Earn Native Token $BEST
- 250,000+ Monthly Active Users
Join Our Telegram channel to stay up to date on breaking news coverage