Join Our Telegram channel to stay up to date on breaking news coverage
Origin Protocol Price Prediction – June 4
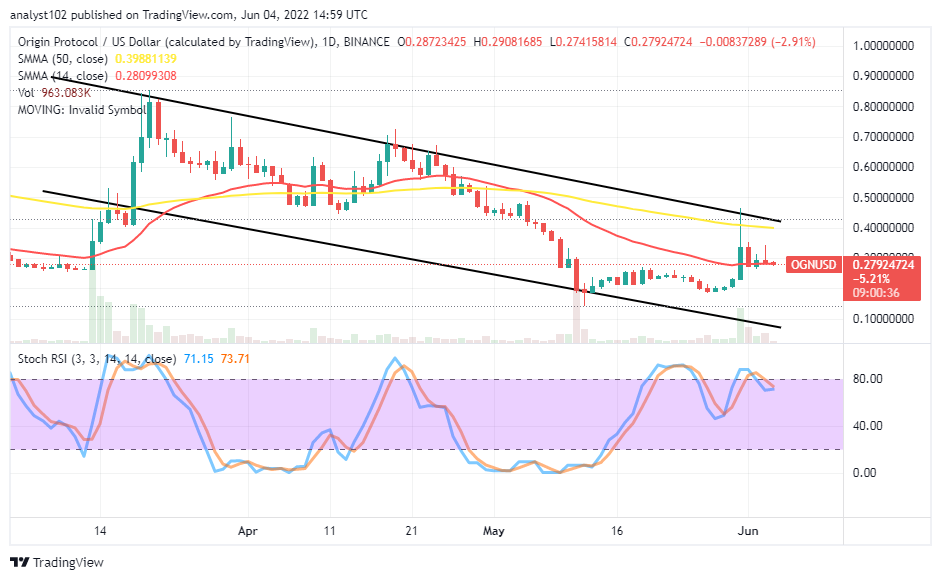
Like many other crypto-economic operations are witnessing downtrends, the OGN/USD market is indifferent. Presently, the trade is trading under depression. Its all-time high value was at 43.39 about a year ago. And the all-time low point is at $0.1032 two years back. Price is trading around $0.27 at a negative percentage rate of 2.91.
Origin Protocol (OGN) Price Statistics:
OGN price now – $0.2792
OGN market cap – $109 million
OGN circulating supply – 388.6 million
OGN total supply – 1 billion
Coinmarketcap ranking – #197
Origin Protocol (OGN) Market
Key Levels:
Resistance levels: $0.40, $0.50, $0.60
Support levels: $0.20, $0.15, $0.10
The daily chart showcases the OGN/USD market is trading under depression. During the last fifth day’s session, a spike arose to touch some resistances around the upper bearish trend line and the bigger SMA. But, the presenting candlestick eventually ended with a top shadow pattern. And that in the subsequent transactions led to a lower-trading point around the smaller-trading indicator. The 50-day SMA trend line is over the 14-day SMA trend line. The Stochastic Oscillators are around the 80 range, trying to close the lines to indicate that in-active price action may have to play out for a while.
Will in-active price action play out for long in the OGN/USD market around the 14-day SMA?
Likely, in-active price motion may play out for a while in the OGN/IUSD market as it is trading under depression over a couple of several sessions. The market’s timely rejection around the $0.40 resistance level on May 31 gave birth to a confirmation trait that longing for positions at higher trading will most be against bears’ brighter chance of regaining the trend’s control. In that wise, buyers may have a better chance to make a comeback while the price pushes to revisit a lower-trading zone close to the lower bearish trend line.
On the downside of the technical analysis, bulls’ capacity to push northward further sustainably above the $0.40 resistance may not be achievable in the near time. If that sentiment won’t be negated by a forceful force that can form against the point to the upside. It will be a good zone for getting selling entry. In the course of continuing with the downward-trending movement, the market may risk going past the previous lower value line of around $0.10
OGN/BTC Price Analysis
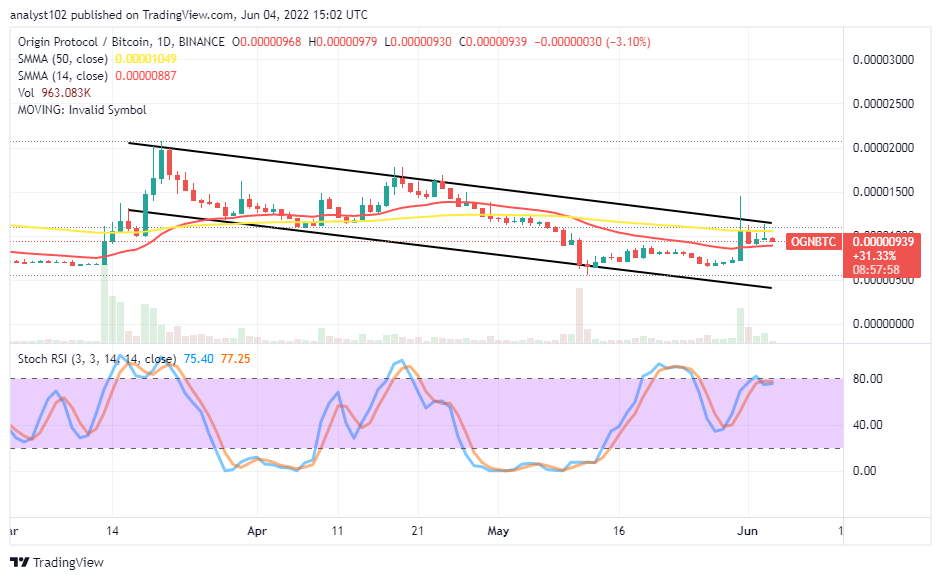
Origin Protocol’s trending capacity compared with Bitcoin on the price analysis chart reveals the pairing crypto-economic market is trading under depression. The base-trading instrument has been prevailed upon by the counter-trading tool. The 50-day SMA indicator is above the 14-day SMA indicator. The Stochastic Oscillators are at the range of 80 to signify forces to the upside may not be forthcoming to the advantage of OGN as it pairs with BTC in the following activities.
Read more:
Join Our Telegram channel to stay up to date on breaking news coverage


