Join Our Telegram channel to stay up to date on breaking news coverage
Origin Protocol Price Prediction – June 14
The OGN market is striving to push upward from a downward trend it has kept within the southward-trading zones on a lighter mode. The crypto trade is bargaining between $0.24 and $0.17 value lines, maintaining a 17.17% positive.
Origin Protocol (OGN) Price Statistics:
OGN price now – $0.2176
OGN market cap – $85.3 million
OGN circulating supply – 388.6 million
OGN total supply – 1 billion
Coinmarketcap ranking – #197
Origin Protocol (OGN) Market
Key Levels:
Resistance levels: $0.30, $0.40, $0.50
Support levels: $0.20, $0.15, $0.10 OGN/USD – Daily Chart
The daily chart reveals the OGN market is striving to push upward from a lower-trading point underneath the trend line of the smaller SMA. The 50-day SMA indicator is above the 14-day SMA indicator. The upper channel trend line drew southward to touch the bigger SMA at the end. And the smaller SMA is not too far below them. The Stochastic Oscillators are in the oversold region, trying to close their lines within it. A bullish candlestick is in the making to suggest the market may soon experience some northward forces.
Is there still room for falls in the OGN/USD market as the price strives to push upward?
The outlook of the daily trading chart still showcases the probability the OGN/USD trade can downsize between the points of the SMA trend lines as the crypto price strives to push upward. While the price holds too long around the 14-day SMA, the presumed downward motion will take off from there. Traders intending to go for long positions opening will have to be alert to get a spot and a rebound from variant support levels before launching a buying order.
On the downside of the technical analysis, there may be early decline-moving forces around the 14-day SMA while the price push purposely touches around the $0.30 resistance level. If that doesn’t play out, the trading area of the conjoining of the 50-day SMA indicator and the upper bearish trend line will likely be a better-off spot for bears to re-launch a decent selling order when the price shows an active reversal-moving sign at a later time.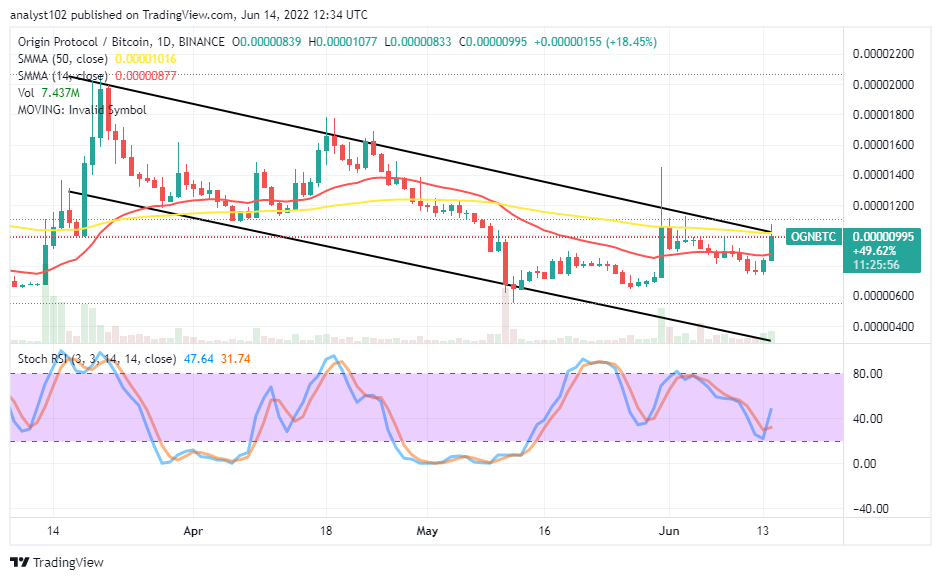
OGN/BTC Price Analysis
Origin Protocol’s trending capacity ability has been finding a stance against the pushing forces of Bitcoin since yesterday’s sessions. The 14-day SMA indicator is underneath the 50-day SMA indicator. A bullish candlestick has emerged, beefing northward against the conjoint area of the upper bearish trend line and the bigger SMA. The Stochastic Oscillators have crossed northbound from the range at 20 to signify that upward pressure is ongoing. The base crypto tends to push higher against the counter-trading crypto. If a bearish candlestick eventually emerges around or above the conjoint-trading spot of those indicators, a decline will take over the market control again.
Read more:
Join Our Telegram channel to stay up to date on breaking news coverage