Join Our Telegram channel to stay up to date on breaking news coverage
The Origin Protocol price prediction prepares for the uptrend, the coin will be technically and fundamentally ready to break above $0.080.
OGN Prediction Statistics Data:
- OGN price now – $0.070
- OGN market cap – $36 million
- OGN circulating supply – 509.4 million
- OGN total supply – 1.0 billion
- OGN Coinmarketcap ranking – #405
OGN/USD Market
Key Levels:
Resistance levels: $0.090, $0.100, $0.110
Support levels: $0.050, $0.040, $0.030
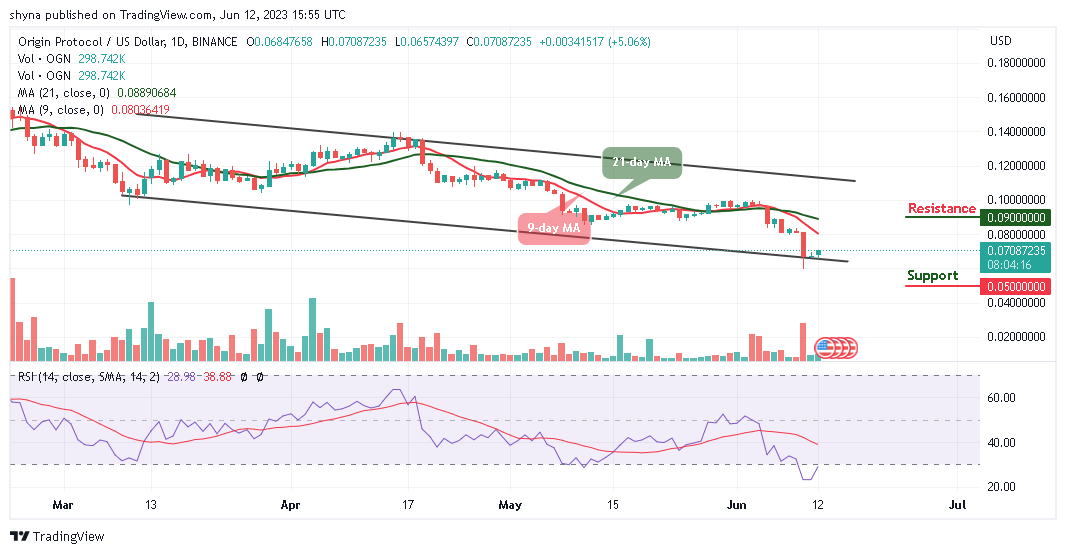
OGN/USD is seen trading toward the 9-day and 21-day moving averages as the coin may kick-start an additional bullish run above $0.080 if the market price crosses above the moving averages. However, the break above this barrier is the first signal needed for a bullish to press higher.
Origin Protocol Price Prediction: What to Expect from Origin Protocol
Looking ahead, if the buyers continue to grind higher, the first resistance level may come at $0.080 as this could also be followed by $0.085. However, additional resistance may also be found at $0.090, $0.100, and $0.110 respectively. On the other side, if the Origin Protocol price crosses below the lower boundary of the channel, it could hit the first support level at $0.060.
However, staying below the moving averages may lead to the critical support levels at $0.050, $0.040, and $0.030. Meanwhile, the technical indicator Relative Strength Index (14) trying to recover above the 30-level, which indicates the buyers are attempting to step into the market and this, could also mean that another signal of OGN could be pushing back above $0.080 soon.
Against Bitcoin, the daily chart shows that the Origin Protocol price is moving toward the upper boundary of the channel around 273 SAT. However, as much as the coin crosses above the 9-day and 21-day MAs, there is a possibility that additional benefits could be obtained in the long term. Therefore, the next resistance key above the resistance level of 300 SAT could even break 350 SAT and above.
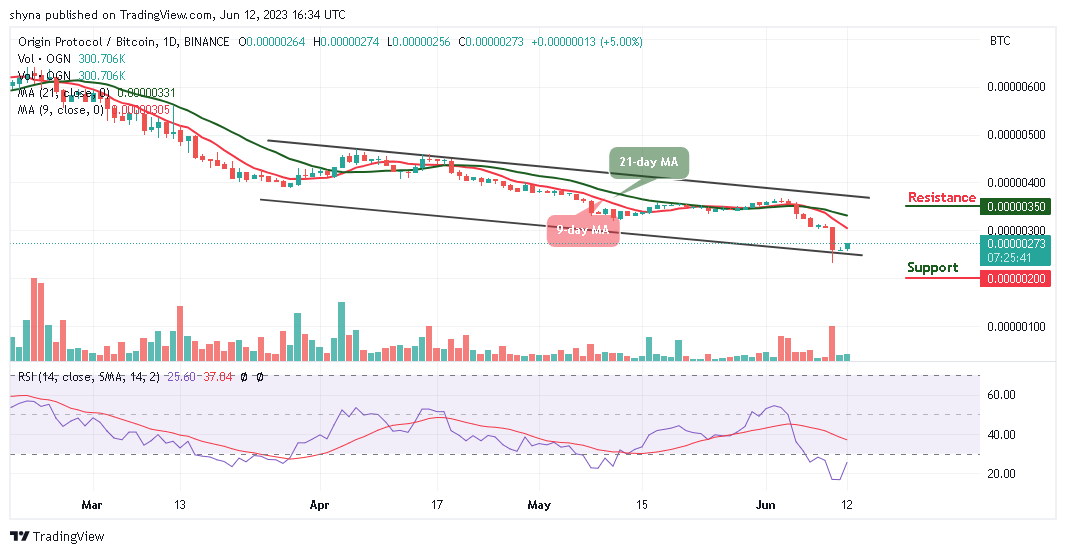
However, if the bears regroup and cross below the lower boundary of the channel, the support level of 250 SAT may play out before rolling to the critical support at 200 SAT and below. The Relative Strength Index (14) is trying to level the oversold region as more bullish signals could play out.
Origin Protocol Alternatives
Nevertheless, if OGN/USD soars toward the upper boundary of the channel, this could be a sign of sustainability and may likely result in a bullish continuation. Furthermore, if the Origin Protocol price fails to move up; traders may see a price cut below the lower boundary of the channel, and a further low could bring the price to the support level of $0.050. Meanwhile, the broader crypto market has taken a hit, Wall Street Memes (WSM) has remained resilient – and become a hot topic among influential YouTubers in the crypto space. the WSM token has achieved almost $7m in its presale as this will provide excellent retail trading tools to the traders.
Read more:
- Ripple Price Prediction: XRP/USD Falls Below $0.23 But A Bullish Crossover Could Push it Up
- Bitcoin Price Prediction: BTC/USD Rallies to $10,000, Can It Reach the $10,500 Mark?
New OKX Listing - Wall Street Memes

- Established Community of Stocks & Crypto Traders
- Featured on Cointelegraph, CoinMarketCap, Yahoo Finance
- Rated Best Crypto to Buy Now In Meme Coin Sector
- Team Behind OpenSea NFT Collection - Wall St Bulls
- Tweets Replied to by Elon Musk
Join Our Telegram channel to stay up to date on breaking news coverage