Join Our Telegram channel to stay up to date on breaking news coverage
The Orchid price prediction shows that OXT is moving with an uptrend, and traders could expect an early arrival of a price rally.
Orchid Prediction Statistics Data:
- Orchid price now – $0.067
- Orchid market cap – $63.5 million
- Orchid circulating supply – 962.6 million
- Orchid total supply – 1 billion
- Orchid Coinmarketcap ranking – #306
OXT/USD Market
Key Levels:
Resistance levels: $0.090, $0.100, $0.110
Support levels: $0.045, $0.040, $0.035
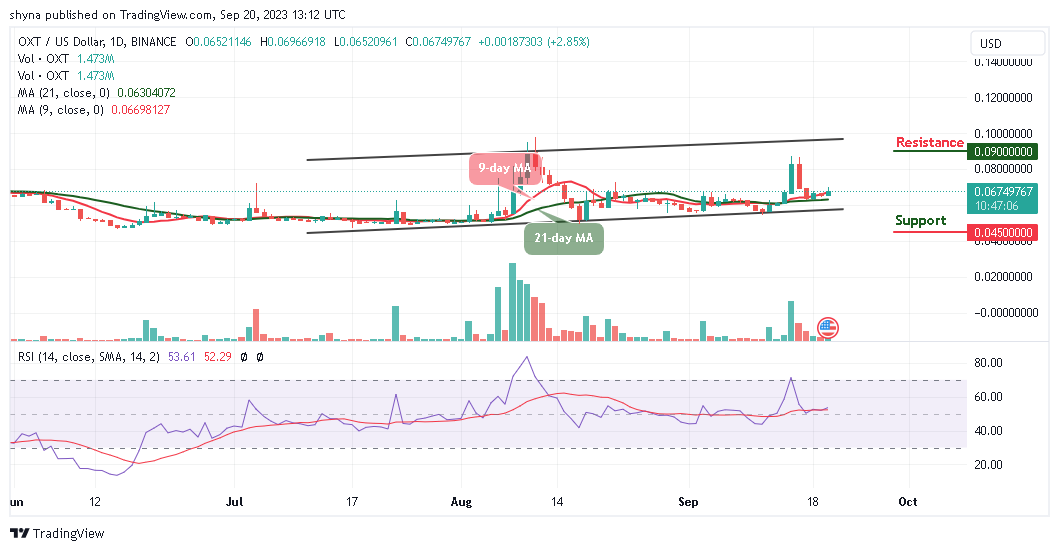
The current trading scenario for OXT/USD appears bullish, with the coin maintaining its position above the 9-day and 21-day moving averages. Despite market pressures, the Orchid price has shown a consistent upward trend in the last few hours. However, the overall crypto market is performing well, and the Orchid price is likely to flourish further if bullish momentum continues.
Orchid Price Prediction: There Could Be Potential Upside for OXT
The Orchid price is currently holding steady at the $0.067 level, if the $0.065 support level is tested again and fails, it may lead to a downside break. In such a scenario, critical support levels at $0.045, $0.040, and $0.035 may come into play.
At the moment, the Orchid price remains within the moving averages, supported by a relatively weak bullish momentum and mildly positive technical indicators. If the buying pressure strengthens and pushes the coin toward the upper boundary of the channel, resistance levels at $0.090, $0.100, and $0.110 could be targeted. Meanwhile, the Relative Strength Index (14) is currently above the 50-level, suggesting potential sideways movement for the coin.
OXT/BTC Could Move Sideways
Comparing Orchid’s performance to Bitcoin, OXT price may see gradual upward movement if crosses above the 9-day moving average. The OXT/BTC pair is currently trading within a defined channel, and traders are awaiting a bullish push, with the Relative Strength Index (14) indicating a bullish movement above the 50-level.
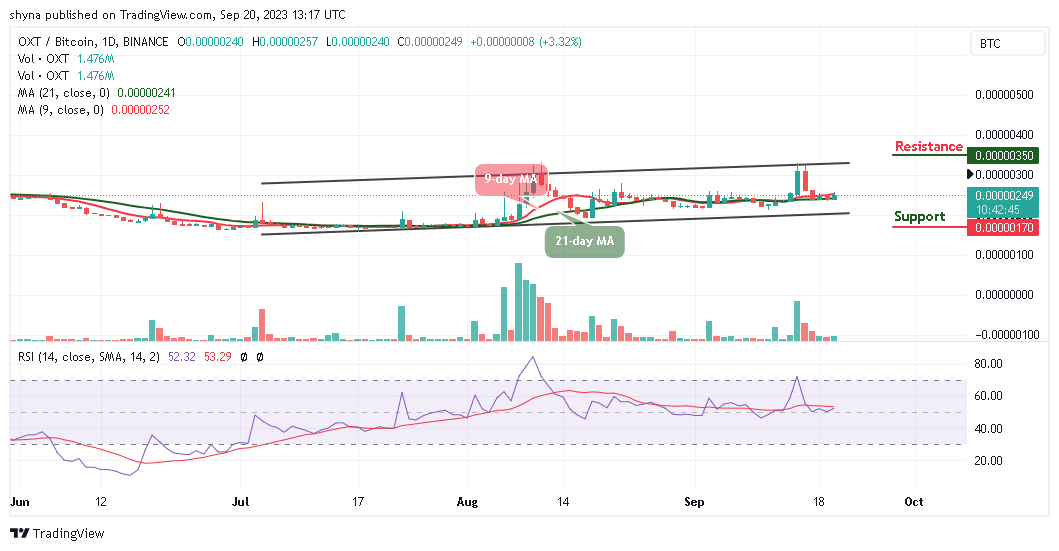
Moreover, if the bulls break above the 9-day moving average, initial resistance could be encountered at 300 SAT, followed by a higher resistance level at 350 SAT and above. Conversely, if the slides are below the lower boundary of the channel, critical support may be found at 170 SAT and below.
Orchid Alternatives
The Orchid price is currently experiencing a slight retracement, hovering above $0.065 with a modest 2.85% price increase. As the coin displays some gains, it may continue to rise within the established channel, provided that bullish pressure persists.
Additionally, Wall Street Memes ($WSM) has recently secured over $25 million in its presale, positioning itself for an upcoming official exchange launch. This development has gathered significant attention in the crypto world, making Wall Street Memes ($WSM) one of the year’s noteworthy crypto sensations. Investors are encouraged to consider this opportunity in the crypto market.
New OKX Listing - Wall Street Memes

- Established Community of Stocks & Crypto Traders
- Featured on Cointelegraph, CoinMarketCap, Yahoo Finance
- Rated Best Crypto to Buy Now In Meme Coin Sector
- Team Behind OpenSea NFT Collection - Wall St Bulls
- Tweets Replied to by Elon Musk
Join Our Telegram channel to stay up to date on breaking news coverage