Join Our Telegram channel to stay up to date on breaking news coverage
The Orchid price prediction is recovering from the daily opening price at the $0.060 level as the price moves to cross above the moving averages.
Orchid Prediction Statistics Data:
- Orchid price now – $0.062
- Orchid market cap – $59.7 million
- Orchid circulating supply – 962.6 million
- Orchid total supply – 1 billion
- Orchid Coinmarketcap ranking – #322
OXT/USD Market
Key Levels:
Resistance levels: $0.090, $0.100, $0.110
Support levels: $0.035, $0.025, $0.015

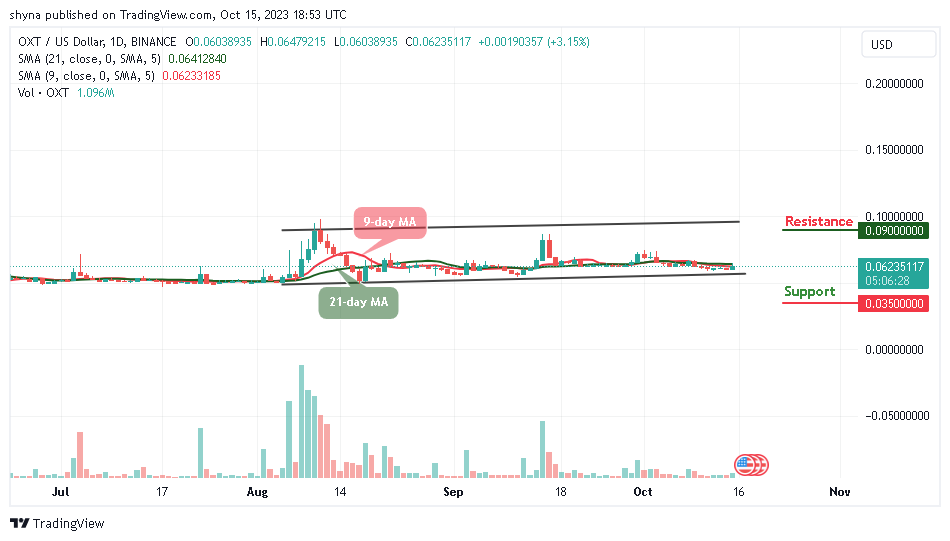
OXT/USD is likely to cross above the 9-day and 21-day moving averages as the coin touches the daily high at the $0.064 resistance level. At the time of writing, Orchid is changing hands at $0.062, having gained over 3.15% since the beginning of the European session. However, with latest the recovery, the coin is likely to face the upper boundary of the channel if the bulls increase the buying pressure.
Orchid Price Prediction: Can Orchid (OXT) Break Above $0.070?
The Orchid price could move to cross above the 9-day and 21-day moving averages at the price level of $0.062. If the bulls maintain the upward trend, OXT/USD may touch the resistance levels of $0.090, $0.100, and $0.110 to keep the price on the upside. On the contrary, any strong selling pressure below the lower boundary of the channel may drag the price to the downside.
However, if the Orchid price trades below the channel, a bearish continuation could bring the price to the supports of $0.035, $0.025, and $0.015. Meanwhile, the 9-day and 21-day MAs are moving in the same direction, indicating a sideways movement.
OXT/BTC Keeps Ranging Within the Channel
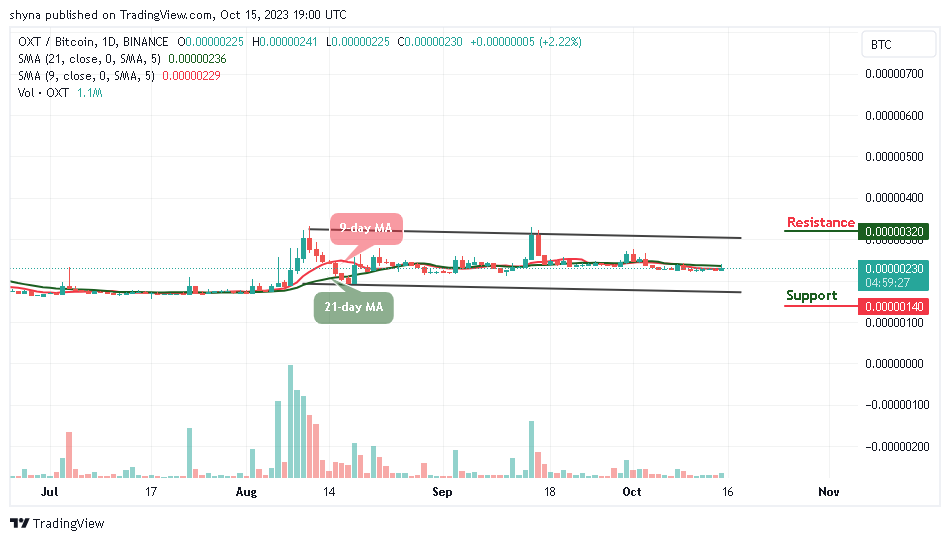
Against Bitcoin, the Orchid price is hovering within the 9-day and 21-day moving averages. However, following the recent positive sign, the current market movement may begin to follow upward movement if the buyers push the price higher and face the upper boundary of the channel.

Moreover, if the 9-day moving average crosses above the 21-day moving average, the market price could hit the resistance level of 320 SAT and above. Meanwhile, a retest below the lower boundary of the channel could lower the price to the support level of 140 SAT and below.
Orchid Alternatives
The Orchid price is trading above $0.060 as the coin trades near the 9-day and 21-day moving averages to touch the resistance level of $0.064. The Orchid price may continue to move upwards if the price crosses above the moving averages. Meanwhile, OXT/USD could reach the resistance level of $0.070 if the bulls focus on the upward trend.
At this very instant, traders have their eyes fixed on an astounding cryptocurrency making a significant impact. Bitcoin Minetrix (BTCMTX) distinguishes itself as a unique Bitcoin alternative, offering a tokenized cloud mining platform to provide secure and transparent Bitcoin access for the average individual. Impressively, this token has already accumulated more than $1.77 million in its presale as traders are urged to consider investment options.
Join Our Telegram channel to stay up to date on breaking news coverage


