
Join Our Telegram channel to stay up to date on breaking news coverage
The Neo price prediction is changing hands at $10.42 above the 9-day and 21-day moving averages after touching the daily high at $10.75.
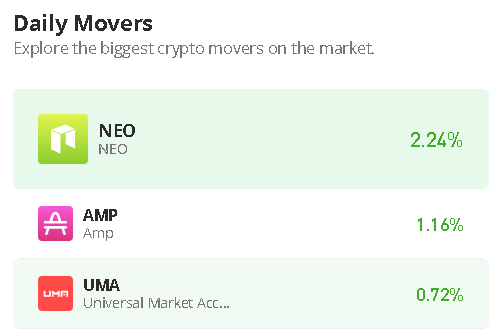
Neo Price Statistics Data:
- Neo price now – $10.42
- Neo market cap – $719.6 million
- Neo circulating supply – 70.5 million
- Neo total supply – 100 million
- Neo Coinmarketcap ranking – #59
NEO/USD Market
Key Levels:
Resistance levels: $14.0, $15.0, $16.0
Support levels: $7.0, $6.0, $5.0
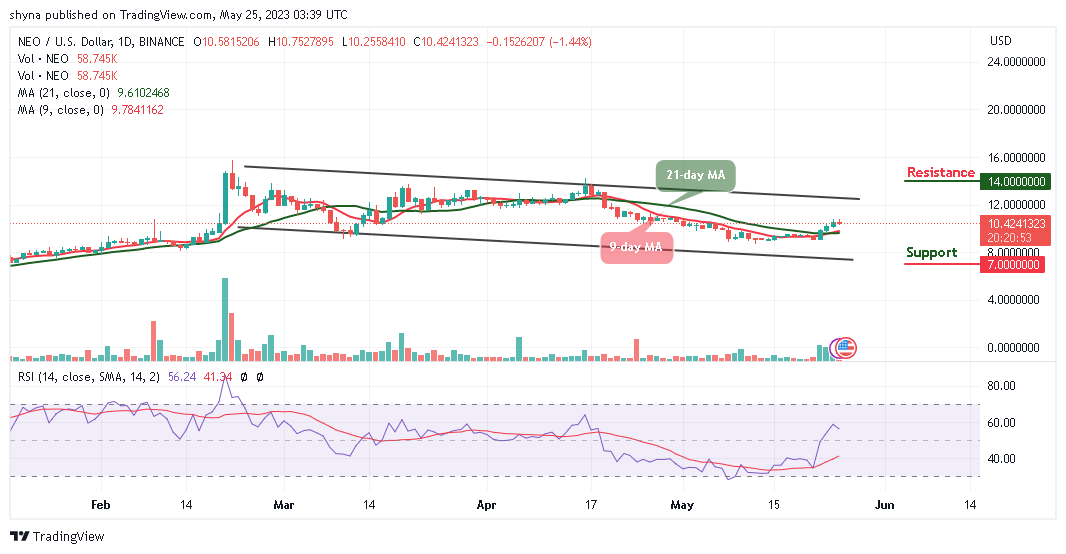
NEO/USD is at the time of writing trading at $10.42. The coin is also moving within the channel and above the 9-day and 21-day moving averages, indicating a bearish movement in the market. For the time being, the market price is moving toward the upper boundary of the channel as the trading volume has been issuing buy signals.
Neo Price Prediction: NEO Price May Hit the Higher Levels
The Neo price may remain above the moving averages if the bulls keep the coin on the upside. Meanwhile, any attempt by the buyers to cancel the current bearish movement and push the Neo price toward the upper boundary of the channel could touch the resistance level of $12.0.
Furthermore, any bullish cross above the upper boundary of the channel could lead the market to crucial resistance levels at $14.0, $15.0, and $16.0. However, if the coin heads toward the lower boundary of the channel, it could reach the critical supports at $7.0, $6.0, and $5.0 as the technical indicator Relative Strength Index (14) moves below the 60-level.
Against Bitcoin, the Neo is trading above the 9-day and 21-day moving averages with a bearish candle but has yet to cross above the upper boundary of the channel. The technical indicator Relative Strength Index (14) remains above the 60-level which could bring more bullish signals into the market. But if the market price drops below the 9-day and 21-day moving averages, it could hit the nearest support at 3500 SAT. Any further drop may likely hit the support level of 3000 SAT and below.
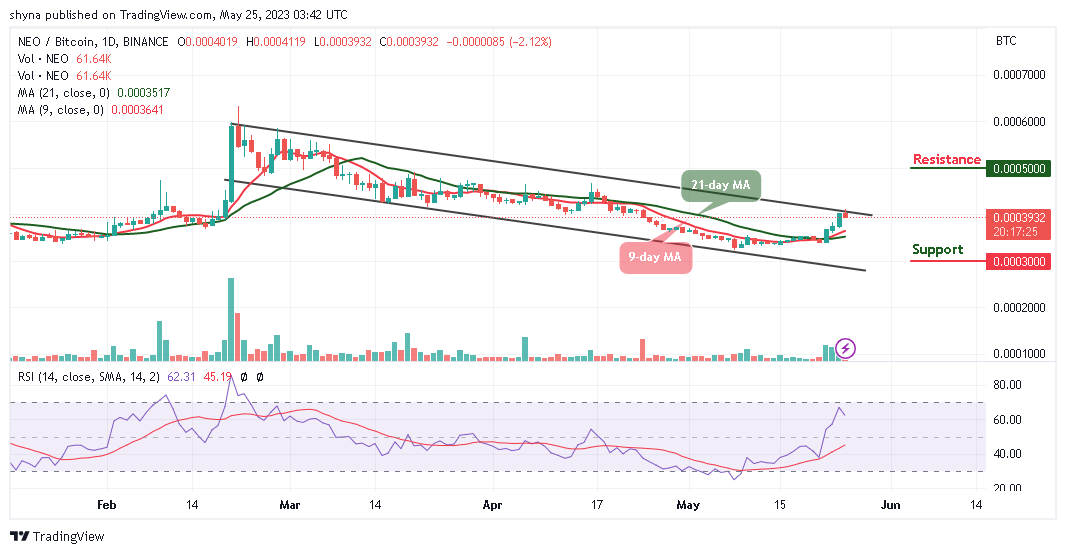
Nevertheless, any form of a rebound from the current level at 3932 SAT could push the coin above the upper boundary of the channel which could hit the resistance level of 5000 SAT and above. Meanwhile, buyers may need to gather enough momentum to push the market price to the north. For now, NEO/BTC is moving bearishly and may start rising once the technical indicator turns upward.
NEO Alternatives
The Neo price is currently trading around $10.42 and once it manages to surpass the potential resistance of $11.00, the next target could be located at $12.00 where it trades above the 9-day and 21-day moving averages. However, a push from here could send the price above the upper boundary of the channel. However, AI processes the input from the user and then creates relevant and engaging memes. There’s also a public wall for sharing and voting on memes. AiDoge uses the native AI token as the main utility token for buying credits to create new memes. Meanwhile, the LHINU has raised almost $12 million in investment since its official presale launch, showing huge excitement from investors.
Join Our Telegram channel to stay up to date on breaking news coverage