
Join Our Telegram channel to stay up to date on breaking news coverage
The NEO price prediction shows that NEO is attempting to cross above the upper boundary of the channel to increase the bullish movement.
NEO Price Statistics Data:
- NEO price now – $13.7
- NEO market cap – $973.4 million
- NEO circulating supply – 70.5 million
- NEO total supply – 100 million
- NEO Coinmarketcap ranking – #58
NEO/USD Market
Key Levels:
Resistance levels: $17.0, $19.0, $21.0
Support levels: $10.0, $8.0, $6.0
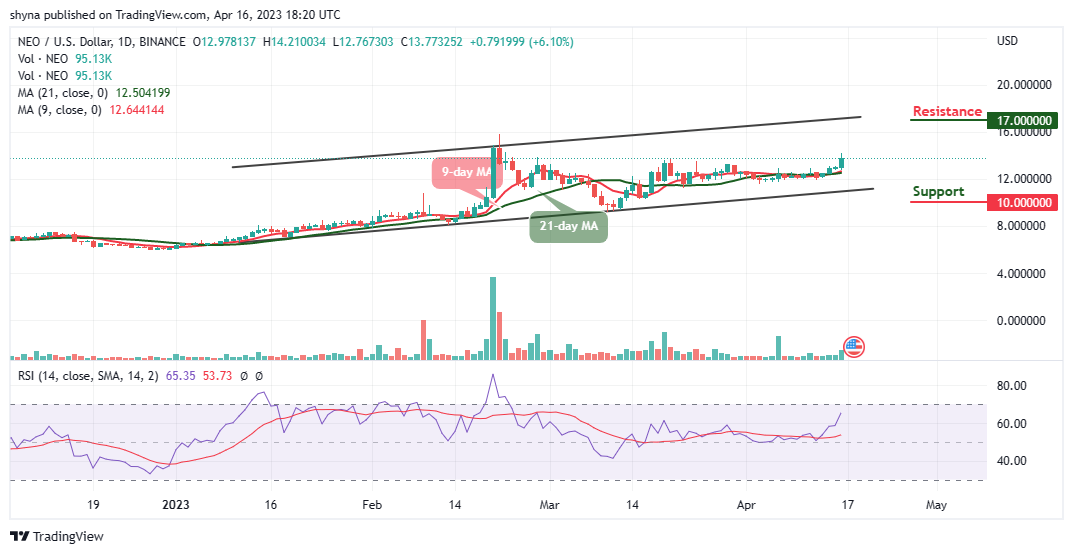
NEO/USD touches the daily high at $14.2, after which the coin retreats to trade at $13.7. Meanwhile, for the price not to touch the resistance level of $15 may ruin the long-term technical picture of the coin. However, the NEO price will have to stay above the 9-day and 21-day moving averages in other to guide against the downward pressure while the closest support expects the coin at $12.0, which could be a daily low.
NEO Price Prediction: NEO Likely to Hit $15 High
The NEO price may continue to trend to the upside if the bulls increase the buying pressure. However, the movement toward the upper boundary of the channel may likely push the coin to the resistance levels of $17.0, $19.0, and $21.0. On the downside, a bearish movement below the 9-day and 21-day moving averages could stop the initial upward movement and create bearish momentum with the focus to bring the market to the next support levels of $10.0, $8.0, and $6.0 respectively.
At the moment, the technical indicator Relative Strength Index (14) moves to cross into the overbought region, which indicates that the market may continue to follow an uptrend. Looking at the daily chart, if the 9-day moving average crosses above the 21-day moving average, this could allow the buyers to concentrate on stirring action to the north.
Against Bitcoin, the NEO price is rising above the 9-day and 21-day moving averages. Meanwhile, following the recent positive sign, the NEO price may go down if the sellers sustain the pressure further. However, if the bears break below the lower boundary of the channel, the market price could reach the support level at 300 SAT and below.
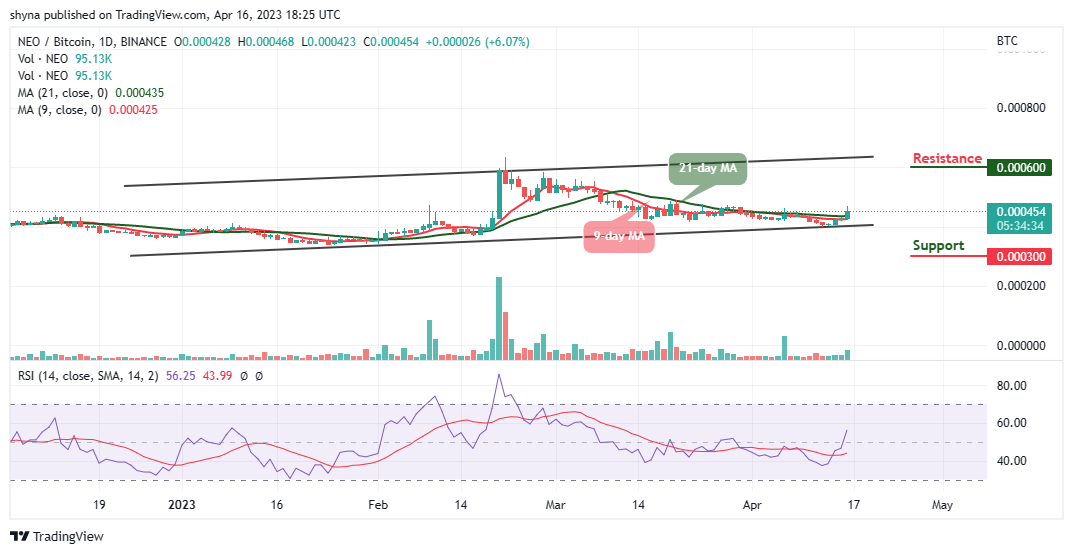
In other words, a positive move could allow the coin to go near the upper boundary of the channel and could hit the resistance level of 600 SAT and above. The technical indicator Relative Strength Index (14) is likely to cross above the 60-level which could boost the bullish movement.
Alternatives to NEO
The NEO price is seen refreshing to a new high as the coin breaches above $13.0 while currently trading at $13.7 with a bullish crossover above the 9-day and 21-day moving averages. The bulls are dominating the market, heading toward the upper boundary of the channel. However, the Love Hate Inu (LHINU) maintains the fundamental principle of decentralization by protecting voters’ identities. This makes it easy to join the community, buy tokens, stake LHINU, and vote on topics. Meanwhile, the LHINU has raised almost $4.5 million in investment since its official presale launch, showing huge excitement from investors.
Read more:
Join Our Telegram channel to stay up to date on breaking news coverage