Join Our Telegram channel to stay up to date on breaking news coverage
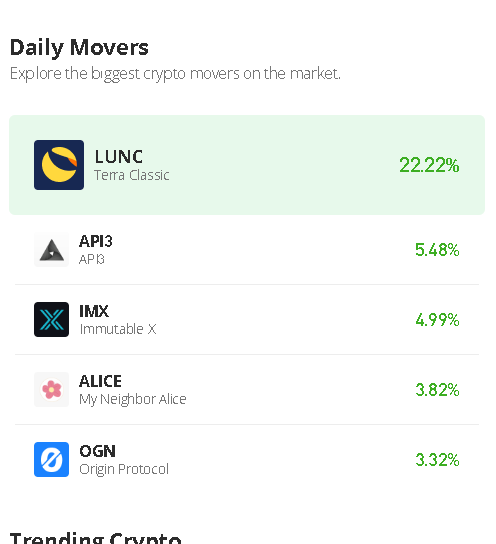
The LUNC price prediction shows that the coin spikes above the upper boundary of the channel as the coin touches $0.00011.
LUNC Price Prediction Statistics Data:
- LUNC price now – $0.00010
- LUNC market cap – $729.4 million
- LUNC circulating supply – 6.5 billion
- LUNC total supply – 6.9 trillion
- LUNC Coinmarketcap ranking – #212
LUNC/USD Long-term Trend: Bullish (4H Chart)
Key Levels:
Resistance levels: $0.00014, $0.00015, $0.00016
Support levels: $0.000080, $0.000070, $0.000060
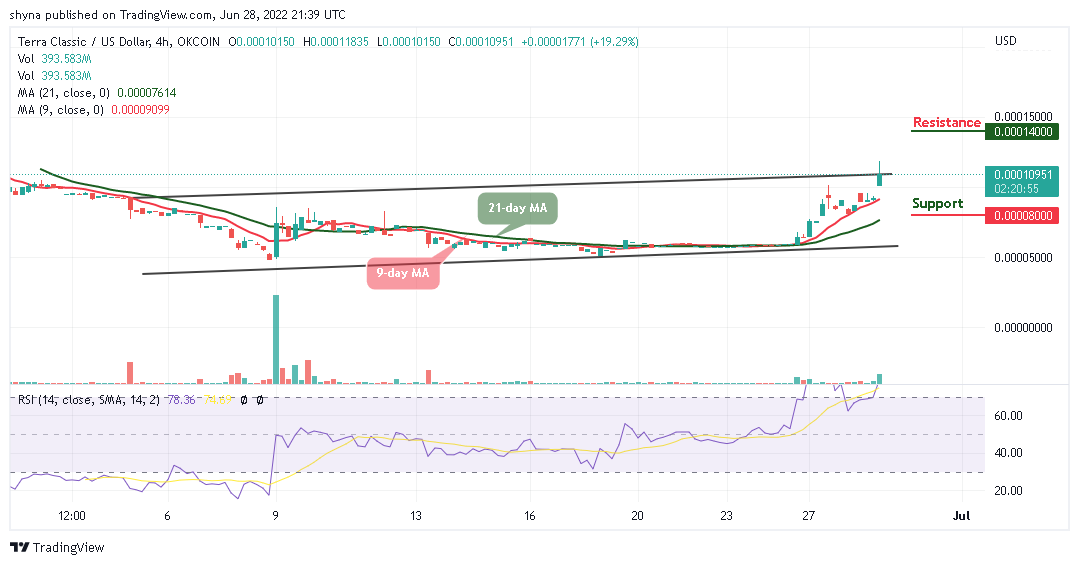
LUNC/USD is breaking to the positive side as the coin is posting gains of over 19.29% in the last 24 hours, with the coin trading above the 9-day and 21-day moving averages at $0.00010.
LUNC Price Prediction: LUNC Shoots to the Upside
The LUNC price is heading to the upside as the coin crosses above the upper boundary of the channel. However, if the market continues the upward movement, the $0.00013 resistance level is likely to surface. Nevertheless, LUNC/USD may further look for higher price levels if the bulls continue to show commitment.
At the time of writing, the market is displaying a sign of subduing volatility within the channel. On the other hand, if LUNC/USD decides to stay under the control of bears, the price may likely locate the supports at $0.000080, $0.000070, and $0.000060. In addition, as the Relative Strength Index (14) moves into the overbought region, the next resistance levels could be found at $0.00014, $0.00015, and $0.00016 respectively.
LUNC/USD Long-term Trend: Bearish (2H Chart)
On the 2-hour chart, LUNC/USD is rising, the coin recently spikes above the 9-day and 21-day moving averages, as it continues to rise towards the nearest resistance level of $0.00012. More so, crossing above the upper boundary of the channel could hit the resistance level at $0.00014 SAT and above.
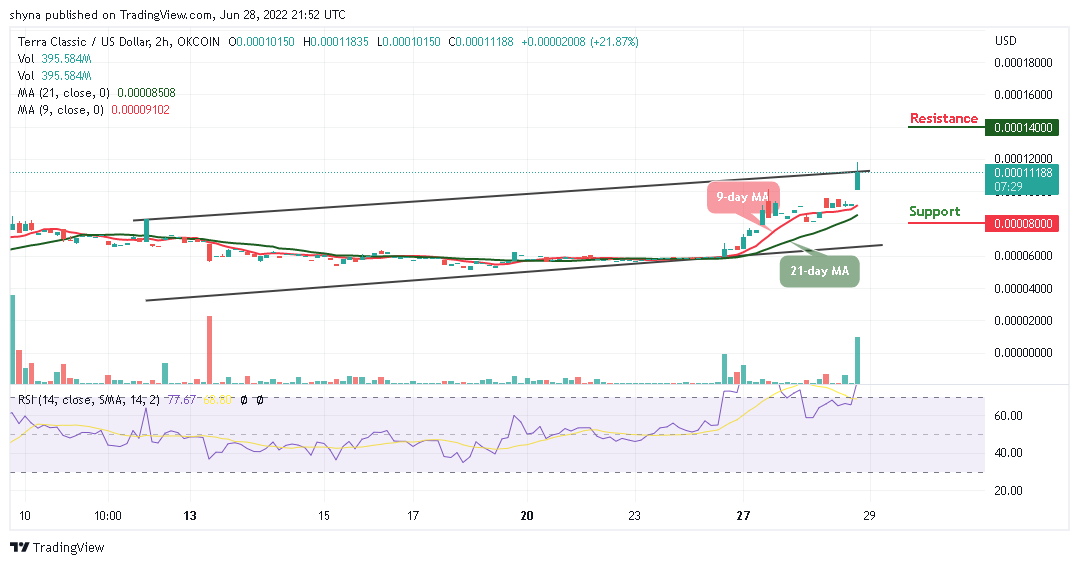
In the other words, any bearish movement by the bears to send the coin below the 9-day and 21-day moving averages may locate the support level at $0.000080 and below. Meanwhile, the technical indicator Relative Strength Index (14) is moving within the overbought region to increase the bullish movement.
Read more:
Join Our Telegram channel to stay up to date on breaking news coverage