Join Our Telegram channel to stay up to date on breaking news coverage
LTC Price Prediction – September 17
The Litecoin price is currently changing hands at $48.41 as the coin maintains the sideways movement.
LTC/USD Market
Key Levels:
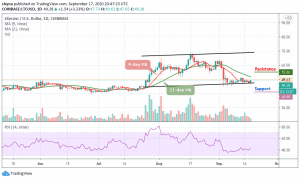
Resistance levels: $55, $57, $59
Support levels: $41, $39, $37
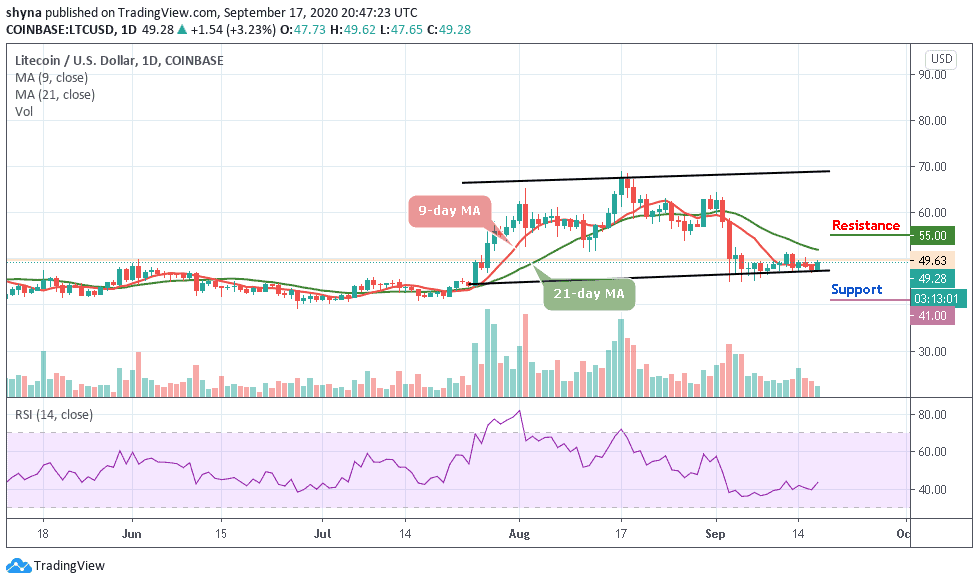
LTC/USD is trading in the green according to the daily chart. The coin is seen trading above the 9-day moving average where the coin has gained over 3.23%. LTC/USD bulls broke out from where it closes yesterday but the price action is yet to cross the 21-day moving average as it remains at the downside within tight conditions.
What Is the Next Direction for Litecoin?
Litecoin (LTC) price has been trapped in an incredibly narrow trading range since a few days ago; the bullish rally has failed to materialize several times. The coin is yet to clear the hurdles towards the resistance level of $50. Instead, the bears are trying to force their way back to the $42 support level.
Looking at it technically, a break below the $41 support level may provoke an even deeper decline towards the $39 and $37 support levels. Looking at the technical indicator RSI (14), LTC/USD may exhibit the tendencies to follow an upward trend as the signal line faces the north, planning to cross above the 45-level; otherwise, the indicator may remain stable at the average.
However, with the current movement, if the bulls can put more effort, they can push the coin above the 21-day moving average, which may cause the price to hit the resistance levels at $55, $57, and $59 respectively.
Against Bitcoin, the Litecoin is still trading around the lower boundary of the channel but yet to cross above the moving averages. For an upward movement, the market price needs to touch the resistance level of 4600 SAT, and closing above it may push the coin to hit the resistance level of 4800 SAT and above.

However, trading below the moving averages could refresh lows under 4300 SAT and a possible bearish continuation may likely meet the major support at 4000 SAT and below while the RSI (14) is seen moving above 35-level, suggesting more bullish signals for the market.
Join Our Telegram channel to stay up to date on breaking news coverage