Join Our Telegram channel to stay up to date on breaking news coverage
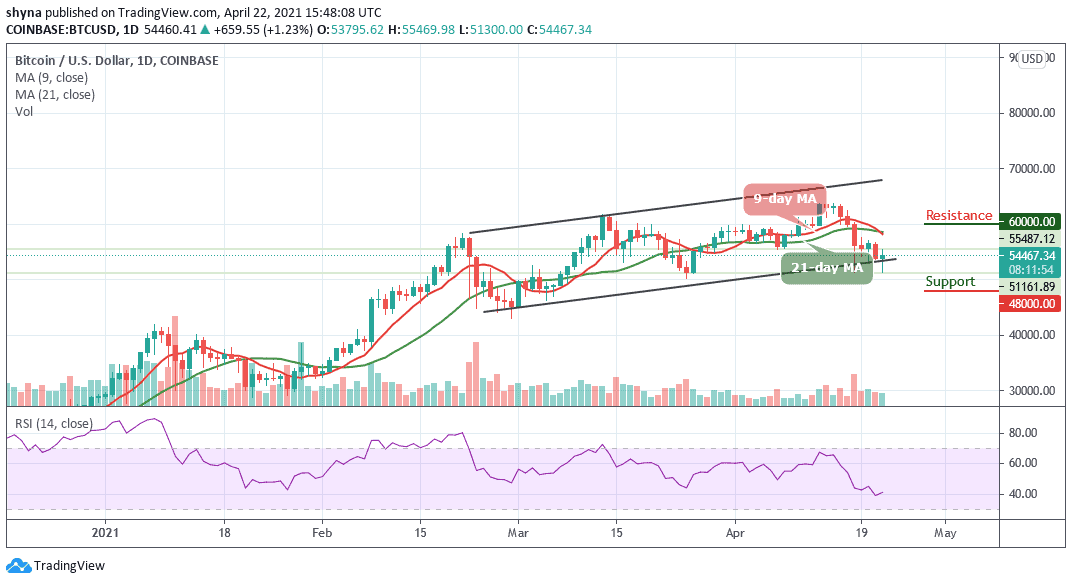
LTC Price Prediction – April 22
The Litecoin price is currently changing hands at $268.83 as the technical indicator RSI (14) moves towards the 60-level.
LTC/USD Market
Key Levels:
Resistance levels: $300, $310, $320
Support levels: $215, $205, $195

LTC/USD is still defending the support level of $250 again as the price hovers around $268.83. The coin is now moving within the 9-day and 21-day moving averages, indicating a bullish movement. For the time being, the market price is moving within the channel and the RSI (14) indicator may be issuing some bullish signals as it heads towards the 60-level.
What to Expect from Litecoin (LTC)
However, looking at the market currently, LTC/USD is yet to show a strong bear dominance in the long term. But the short-term outlook looks bullishly strong. However, a bullish interception may set the next key resistance at $300, $310, and $320, crossing above the moving averages. Nevertheless, it is possible for the traders to experience a little rise before the rally begins.
Furthermore, following the ongoing movement, the price of Litecoin has recently plunged to $251 before a small rise to where it’s currently changing hands at $268. A further rally is likely at $215, $205 with a possible new low at $195. As we can see on the daily price chart, LTC volume has been moving up over the past few days, which shows the bulls may continue to dominate the market.
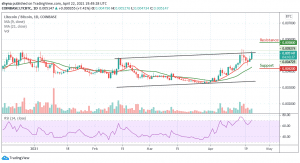
Looking at the daily chart, comparing LTC against BTC, the chart reveals that the pair has eventually broken solid resistance level at 5200 SAT. Litecoin price could see another rise at 5500 SAT support level, going above the upper boundary of the channel. Breaking this level could further push the price to the potential resistance levels at 5800 SAT and 6000 SAT.
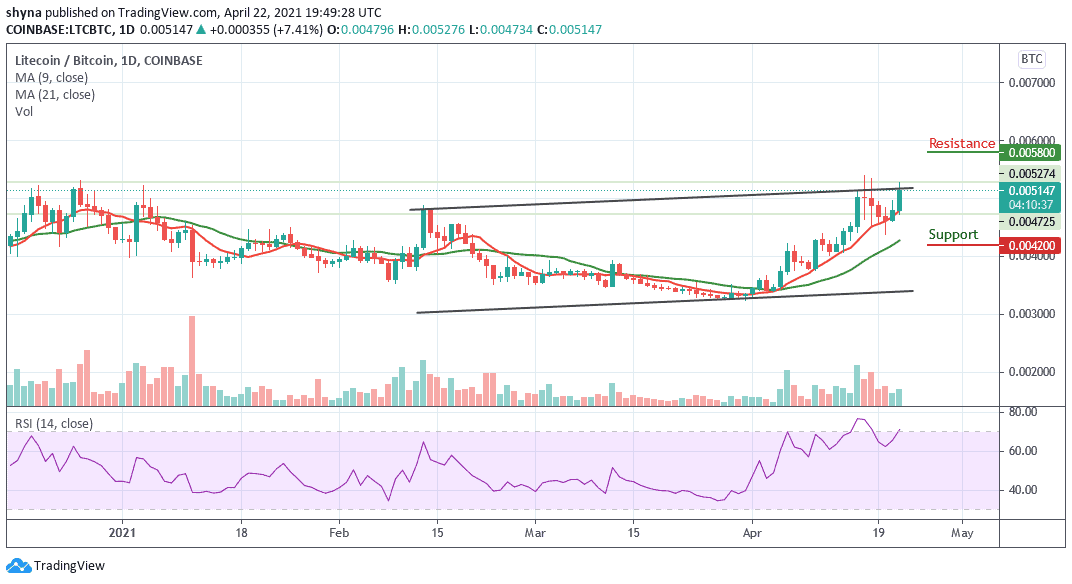
Furthermore, from the downside; the nearest support lie at 4800 SAT and beneath this, further support lies at 4500 SAT. If the price drops further to create a new low, lower support is located at 4200 SAT, 4000 SAT, and 3800 SAT. The RSI (14) is making an attempt to break above the 70-level which shows that the bulls are in control.
Join Our Telegram channel to stay up to date on breaking news coverage