

Join Our Telegram channel to stay up to date on breaking news coverage
Bitcoin (BTC) Price Prediction – April 22
The Bitcoin (BTC) trades in an increasingly tighter range after setting a lower low at $51,300.
BTC/USD Long-term Trend: Bullish (Daily Chart)
Key levels:
Resistance Levels: $60,000, $62,000, $64,200
Support Levels: $48,000, $46,000, $44,000

BTC/USD is bullish as a further downside has been rejected earlier today as the Bitcoin price action looks to set another lower high around $55,300. However, when considering how much the last push to the downside has retraced, not much further downside is expected. Therefore, traders should see another minor retracement later today before Bitcoin pushes higher to the next target at $58,000.
What to Expect from Bitcoin (BTC)
At the opening of the market today, after testing the low of $51,300, BTC/USD is currently trading at $54,467. Meanwhile, looking at the market movement, there is likely that the market may experience a quick retracement or sell-off just after touching the crucial $55,469, and traders may see $56,000 to $57,000 being tested again before pushing higher.
On the downside, if the market decides to fall, BTC/USD could fall below the lower boundary of the channel at $50,500, and if that support fails to hold the sell-off, traders could see a further decline towards the support levels of $48,000, $46,000, and critically $44,000. All the same, any further bullish movement above the 9-day and 21-day moving averages may hit the resistances at 60,000, $62,000, and $64,000 as the technical indicator is making turn above the 40-level, suggesting an upward movement in the market.
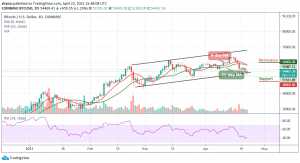
BTC/USD Medium – Term Trend: Bearish (1H Chart)
According to the 1-hour chart, the Bitcoin price first went up but now dropping slightly. If the price continues to drop further and move below the 9-day and 21-day moving averages, it could reach the nearest support levels at $53,500, $53,000, and $52,500 respectively.

Moreover, if the bulls push the coin above the upper boundary of the channel, the price of Bitcoin may likely reach the potential resistance levels of $56,000, $56,500, and $57,000. Presently, the market is indecisive as the RSI (14) indicator moves around the 50-level.
Join Our Telegram channel to stay up to date on breaking news coverage
