Join Our Telegram channel to stay up to date on breaking news coverage
LTC Price Prediction – April 17
The Litecoin price is currently changing hands at $313.18 as the technical indicator RSI (14) moves into the overbought zone.
LTC/USD Market
Key Levels:
Resistance levels: $370, $390, $410
Support levels: $260, $240, $220
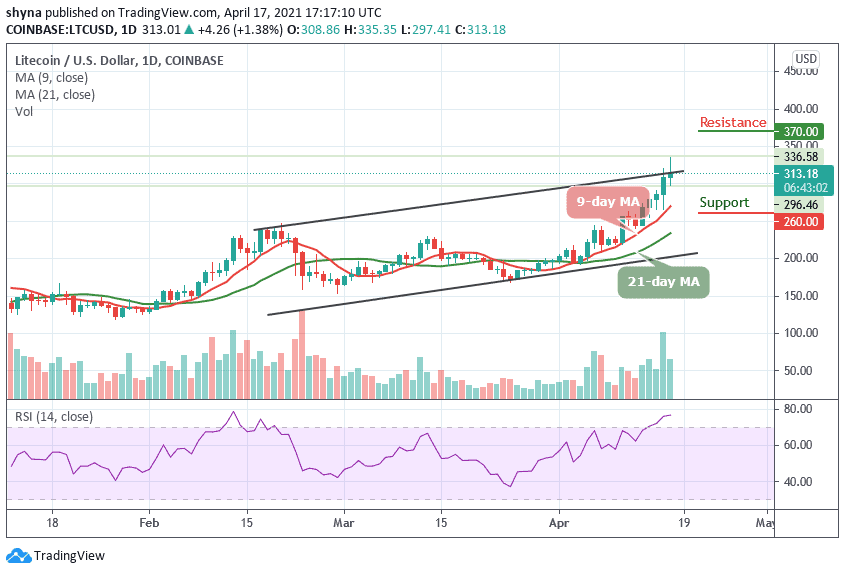
LTC/USD is trading in the green in today’s session, moving around the upper boundary of the channel where the coin is gaining around 1.38% above the 9-day and 21-day moving averages. At the early hour of today, the Litecoin (LTC) bulls broke above the upper boundary of the channel and touched the daily high of $335.35.
What to Expect from Litecoin (LTC)
The market structure reveals that LTC/USD is still sitting above $300. If the price level can hold well, traders may see a buyback at $320 resistance before breaking up to $350 level. But presently, the RSI (14) keeps moving the overbought region while climbing higher may push the coin to the nearest resistance levels of $370, $390, and $410.
On the daily chart, Litecoin is caught in a rising channel pattern for the last few days as bulls gain control of the long-term market. Meanwhile, the short-term trend is still projecting a bearish outlook for the market. Considering the latest price drop, the market is likely to fall at $260, $240, and $220 support levels, crossing below the moving averages.
When compares with Bitcoin, Litecoin price is making an attempt to cross the upper boundary of the channel in other to reach the additional resistance at 0.0055 BTC. Unless this coin crossed above this barrier and the price ends up closing above it, there might not be any reason to expect the long-term bullish reversal.
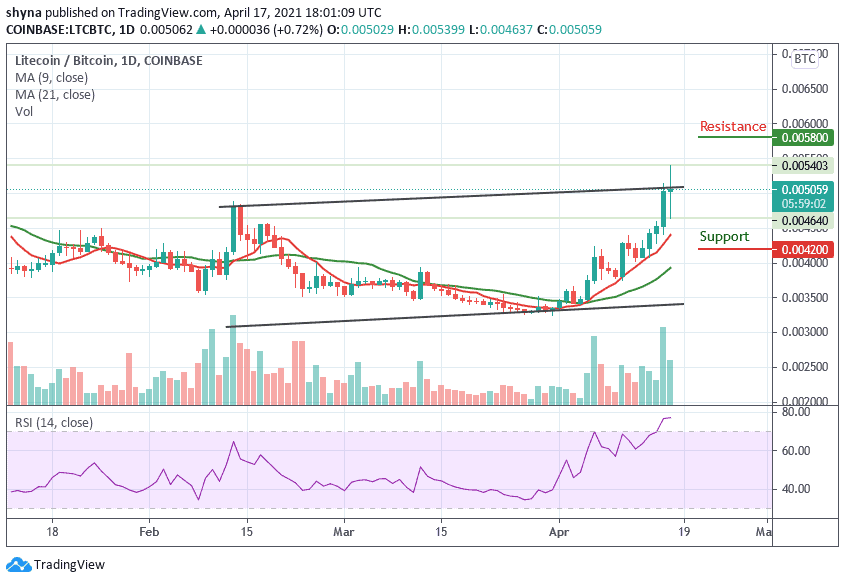
Meanwhile, trading below the nearest support could refresh lows under 0.0045 BTC and a possible bearish continuation may likely meet the major support at 0.0043 BTC before falling to 0.0042 BTC and below while the buyers may push the market to the potential resistances at 0.0058 BTC and above. However, the technical indicator RSI (14) may soon be coming out of the overbought zone to start giving bearish signals.
Join Our Telegram channel to stay up to date on breaking news coverage