Join Our Telegram channel to stay up to date on breaking news coverage
Bitcoin (BTC) Price Prediction – April 17
After hitting its all-time high above $62,572 on the day, the king coin is seen moving with a bit of downward pressure.
BTC/USD Long-term Trend: Bullish (Daily Chart)
Key levels:
Resistance Levels: $65,000, $67,000, $69,000
Support Levels: $56,000, $54,000, $52,000
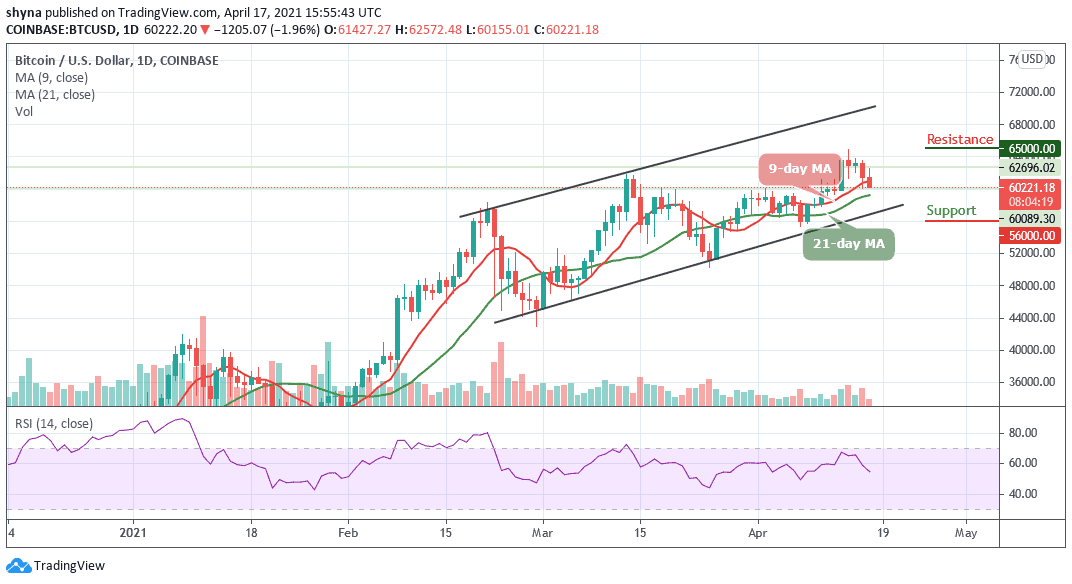
As the market blinks in subtle red for BTC/USD as the first digital asset is seen moving around $60,221 with a loss of 1.96% within 24 hours. According to the daily chart, the number one cryptocurrency hit a brick wall on the approach to $63,000 but immediately dropped under the $62,572 resistance level in a matter of hours.
Would Bitcoin Go Up or Down?
After yesterday’s fall, BTC/USD is facing another decline today as the coin crosses below the 9-day moving average. Meanwhile, any further bearish movement may cause the coin to experience more downfalls. Presently, BTC/USD is seen trading below the $61,000 and $60,500 support levels. However, the price level of $60,000 is still proving that bulls are in charge but bears are now pushing the price back to retest the nearest support level of $58,000.
On the downside, the technical indicator RSI (14) crosses below 60-level to confirm the bearish movement and initial support is near the lower boundary of the channel; if there is a successful break below this barrier, the bears are likely to gain strength by bringing the price to a low of $56,000, $54,000, and $52,000 respectively.
However, an upside break above the daily high of around $62,572 is a must to start a substantial recovery. Meanwhile, the next hurdles may be seen near the resistance levels of $65,000, $67,000, and $69,000.
BTC/USD Medium – Term Trend: Ranging (4H Chart)
According to the 4-hour chart, BTC/USD is currently trading around $60,553 and below the 9-day and 21-day moving averages after falling from $60,627 where the coin touched today. Meanwhile, the 4-hour chart shows that the bullish supply may be coming up slightly as the RSI (14) makes a quick turn to the upside.
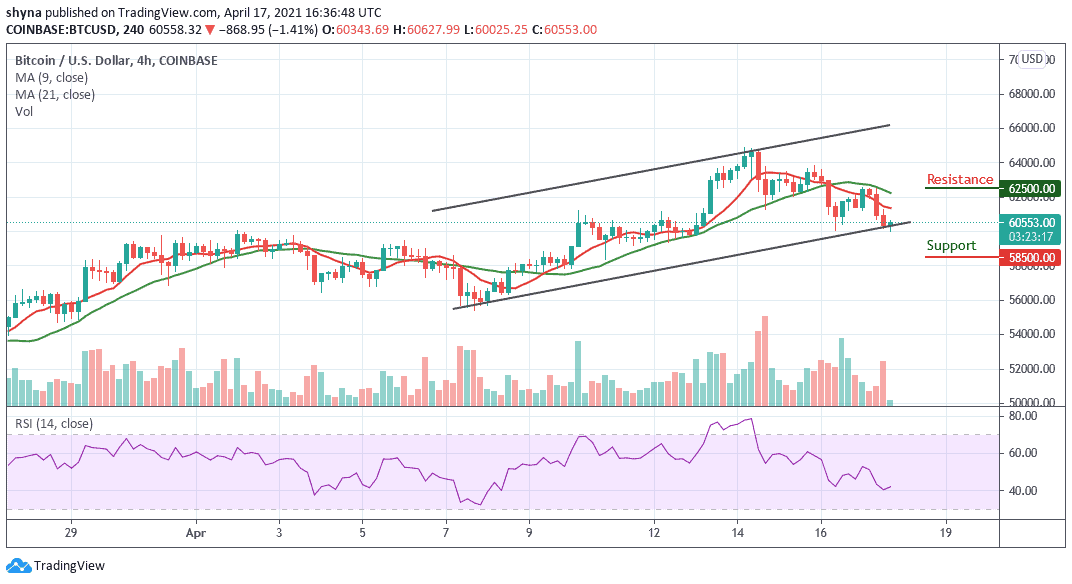
However, in as much as the buyers can re-energize the market, they can further push the price back above the moving averages. Therefore, breaking this barrier could allow bulls to retest the resistance level of $62,500 and above. But any further movement below the lower boundary of the channel may reach the support level of $58,500 and below.
Join Our Telegram channel to stay up to date on breaking news coverage