Join Our Telegram channel to stay up to date on breaking news coverage
LTC Price Prediction – April 12
Litecoin (LTC) faces a sharp price decline of around 3.83% at the time that the market opens and it currently trades at $242.76.
LTC/USD Market
Key Levels:
Resistance levels: $280, $290, $300
Support levels: $220, $210, $200

The daily chart reveals that LTC/USD is trading in red as the coin slides toward the 9-day moving average. A few hours ago, the cryptocurrency couldn’t break $260 and it’s been rejected. More importantly, the bulls may need to climb above the upper boundary of the channel convincingly as a clear break of this barrier could take the coin up to the $270 level.
What is the Next Direction for Litecoin?
According to the daily chart, the Litecoin price touches the daily low of $240.14, therefore, if the nearest support of $240 gives way, the sell-off may come to play and it may be extended towards the psychological $230. Meanwhile, sellers may be more dominant if the bears continue to post firm commitment as the technical indicator RSI (14) shows a downward trend, indicating the latest selling pressure on the market.
However, traders could see a sharp drop below the 9-day moving average. Breaking this barrier could further weaken the market to supports at $220, $210, and $200. Meanwhile, a possible swing towards the upside may likely retest the previous resistance levels above the upper boundary of the channel. Meanwhile, if the buyers manage to fuel the market more, traders may expect a further increase to $280, $290, and $300 resistance levels.
Against BTC, the Litecoin price continues to follow the downtrend. For a trend reversal, there’s a need for an increase in volume to cause an upsurge in the market. Now, the coin is trading towards the 9-day and 21-day moving averages. We can expect close support at the 4000 SAT before breaking to 3700 SAT and critically 3500 SAT.
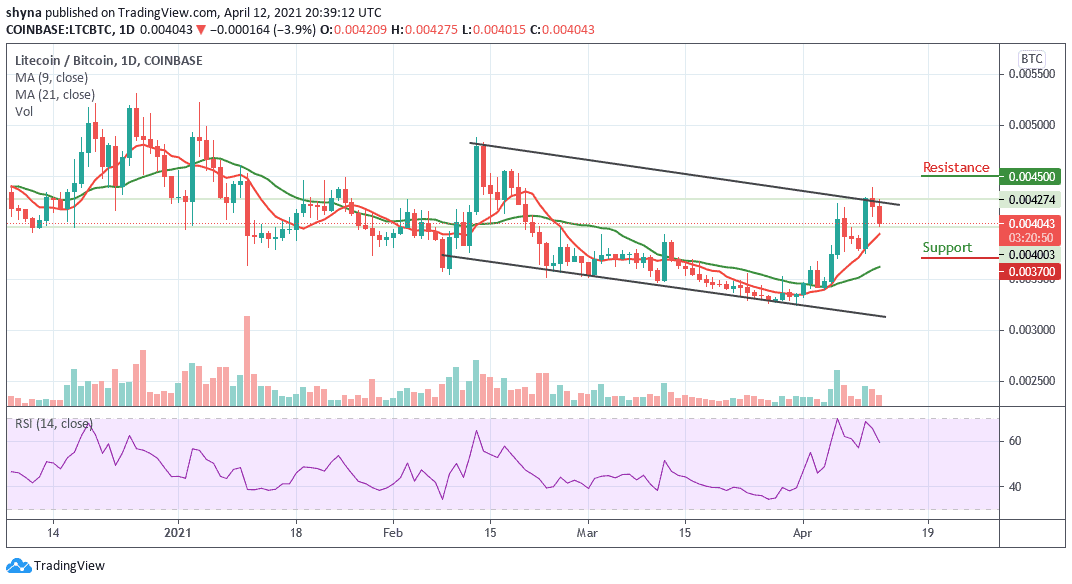
More so, there’s no sign of a bullish move for the Litecoin market at the moment but if a bullish move occurs and validates a break significantly above the upper boundary of the channel and hits the nearest resistance at 4300 SAT; we can then confirm a bull-run for the coin as the closest resistance lies at 4500 SAT and 4700 SAT.
Join Our Telegram channel to stay up to date on breaking news coverage