Join Our Telegram channel to stay up to date on breaking news coverage
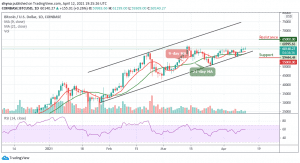
Bitcoin (BTC) Price Prediction – April 12
The technical indicator RSI (14) is currently moving in sideways, reflecting that the Bitcoin price is in a consolidation mode.
BTC/USD Long-term Trend: Bullish (Daily Chart)
Key levels:
Resistance Levels: $65,000, $68,000, $70,000
Support Levels: $55,000, $53,000, $51,000
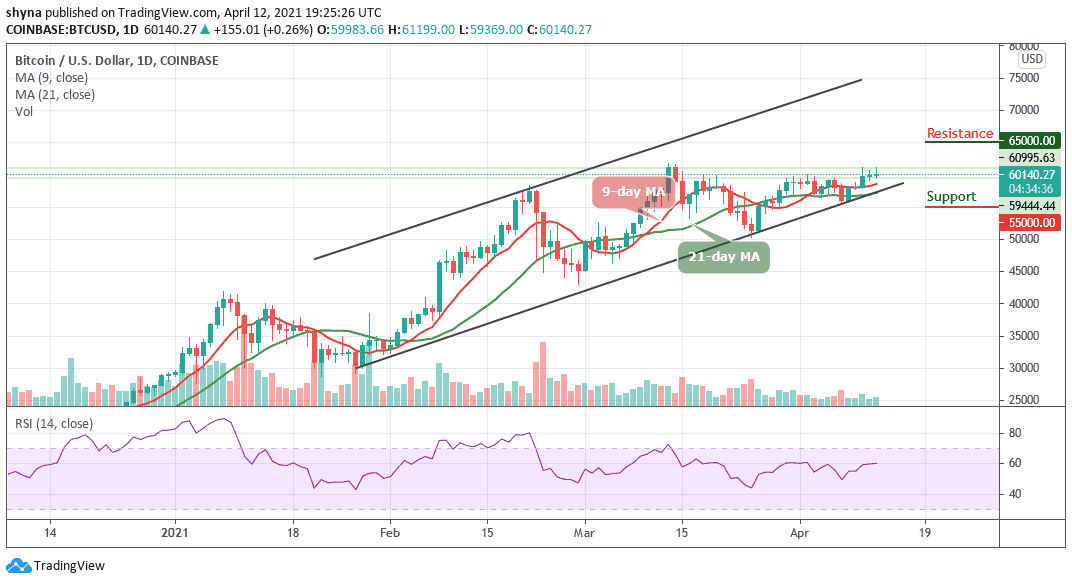
At the moment, BTC/USD is currently erasing the majority of its gains. As of writing, the Bitcoin (BTC) hovers at $60,140 with a gain of 0.26% on a daily basis. For now, the price is seriously struggling in consolidation mode on intraday trading, which has made the BTC indecisive in recent days. But if the buyers can regroup and overcome the supply area, we may see a decent bullish run in the market soon.
What to Expect From Bitcoin (BTC)
While remaining as the most influential cryptocurrency in the world, BTC/USD is technically supported by the $60,000 on short-term and $59,000 support in the medium-term. If the price of Bitcoin drops below these supports, we should expect long-term support at $58,000. More so, any further movement below the 9-day and 21-day moving averages may lead to the support levels of $55,000, $53,000, and $51,000 respectively.
However, if the buyers power the market, traders can expect a retest at the $61,200 resistance level. Breaking the mentioned resistance may further allow the bulls to test the potential resistance at $65,000, $63,000, and $61,000 on the upside. However, as the RSI (14) moves in the same direction on the daily chart, the price of Bitcoin is currently consolidating and moving in sideways on the long-term outlook.
BTC/USD Medium-Term Trend: Bullish (4H Chart)
BTC/USD is still trading around $60,017 after touching $60,160 in the early hours of today. Looking at the hourly price chart, we can see that the bearish supply is coming in the market slowly, but the bulls are also trying to defend the $59,000 supports. Meanwhile, the $58,000 support level and below may come into play if BTC breaks the mentioned support.
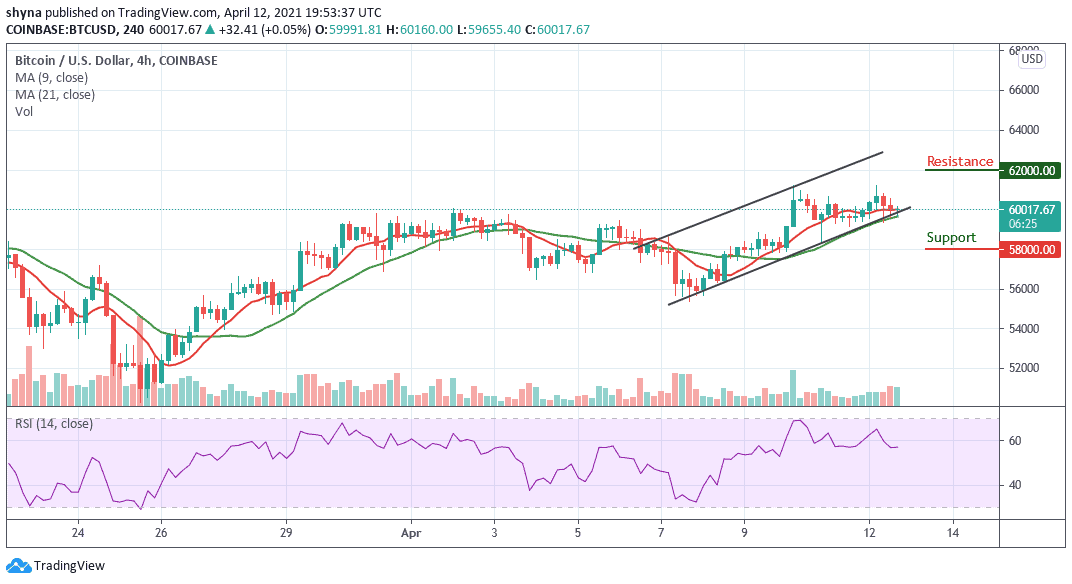
However, if buyers can strengthen and energize the market, we can expect a retest of $61,000 resistance level. Therefore, breaking the mentioned resistance could also allow the bulls to test the $62,000 and $64,000 upward. However, BTC/USD is consolidating and moving in sideways on the medium-term outlook.
Join Our Telegram channel to stay up to date on breaking news coverage