Join Our Telegram channel to stay up to date on breaking news coverage
LTC Price Prediction – March 28
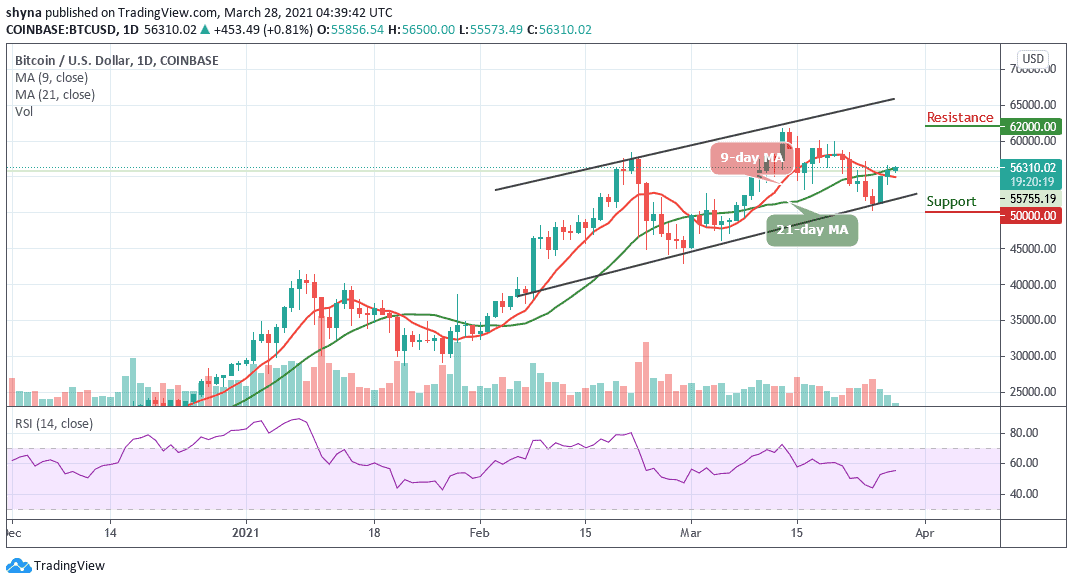
Litecoin (LTC) manages to maintain its position as the coin moves sideways while the bulls still maintain the desire to defend the support at $170.
LTC/USD Market
Key Levels:
Resistance levels: $215, $225, $235
Support levels: $160, $150, $140
The intraday movement in Litecoin has not been impressive enough. If LTC/USD improves in the last hours of the day, the intraday traders can expect a positive close. At present, the main cryptocurrencies are slightly under market pressure. Traders hope for improvement, but it may take some time.
Where is LTC Price Going Next?
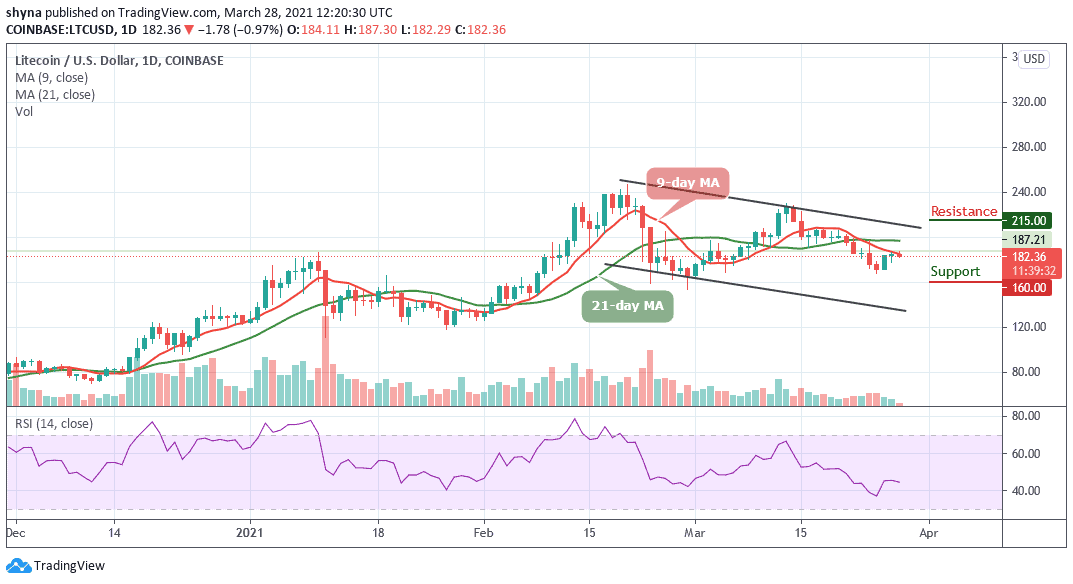
A couple of days ago, LTC/USD started with a trading price of about $171.52 and closed the day with $183.70. Yesterday, the market opened with a downtrend after which the bulls grabbed the price and pushed it to the point where it closed at $184.14. Today, with this fall, the coin might not be able to maintain its effectiveness before showing some signs of downward trends.
Moreover, the intraday movement of the coin is quite unstable as the 9-day MA is below the 21-day MA. However, starting at $180, a rebound might occur and if the bulls put more effort one more time, they push the Litecoin price far above the upper boundary of the channel. The potential resistances to watch are $215, $225, and $235 while the supports are located at $160, $150, and $140 respectively. More so, the technical indicator RSI (14) is seen moving in the same direction around 45-level, suggesting a sideways movement.
Against Bitcoin, Litecoin price is moving down slowly below the 9-day and 21-day moving averages. For now, bulls continue to dance to the tune of bears and currently trading at the 3286 SAT level. At the moment, the buyers continue to suffer a serious downtrend pressure from the sellers.
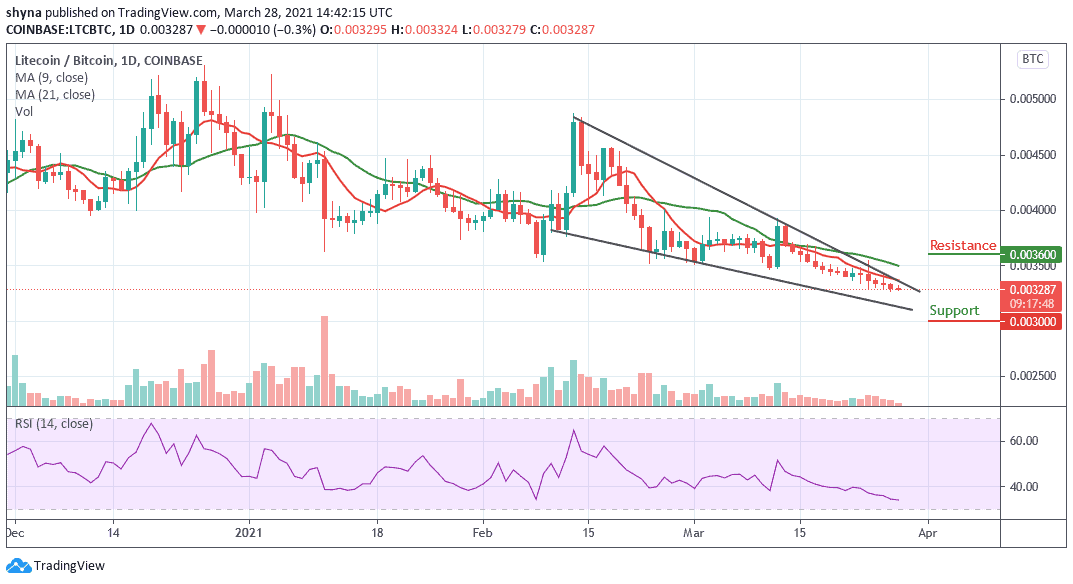
However, if the price cross below the lower boundary of the channel, the nearest key support lie at 3100 SAT, but further support could be found at 3000 SAT and 2800 SAT in a subsequent move. Similarly, an upward movement above the channel is likely to find immediate resistance at 3500 SAT, If the bulls climb above this level, higher resistance lies at 3600 SAT and above. Meanwhile, the RSI (14) is convincingly moving into the oversold region and as it stands now, the bears continue to gain control of the market.
Join Our Telegram channel to stay up to date on breaking news coverage