Join Our Telegram channel to stay up to date on breaking news coverage
Bitcoin (BTC) Price Prediction – March 28
The price of Bitcoin is seen trading nicely above $56,000 and the coin must climb above the $58,000 resistance to continue higher.
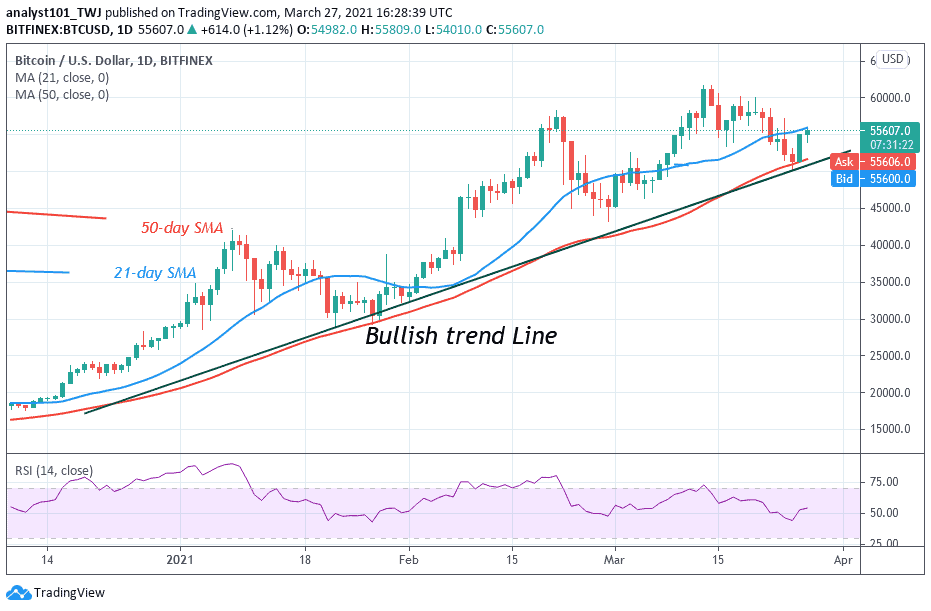
BTC/USD Long-term Trend: Bullish (Daily Chart)
Key levels:
Resistance Levels: $62,000, $64,000, $66,000
Support Levels: $50,000, $48,000, $46,000
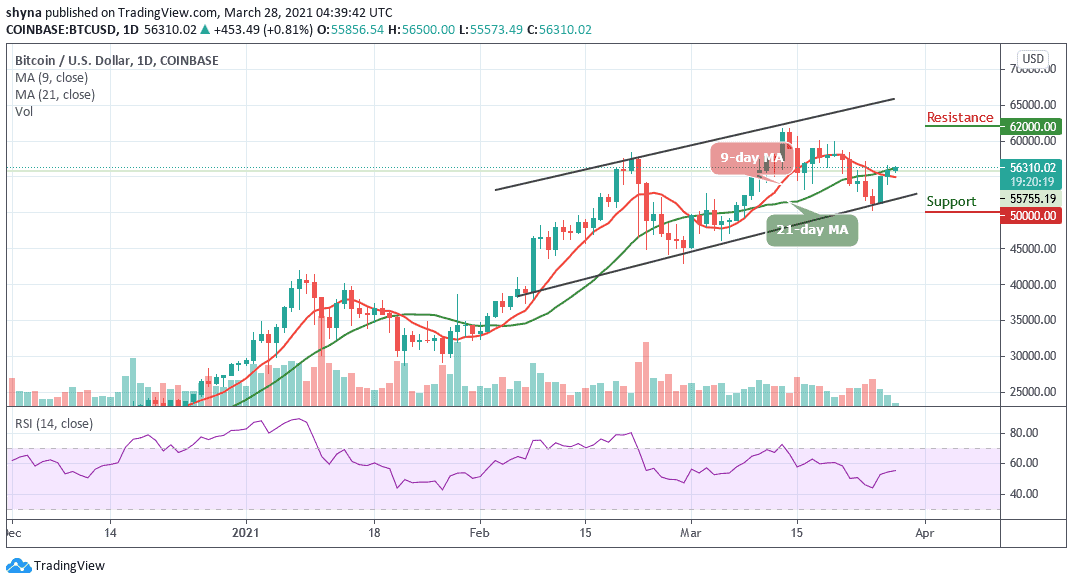
BTC/USD bulls may slowly come back into action as the coin trades above the 9-day and 21-day moving averages. Today, BTC/USD hovers at $56,310 after soaring to $56,500. The coin is now seen pulling to where it is currently trading and may continue to head upwards if the bulls put more effort.
What to Expect from Bitcoin
Presently, the market is deciding within the moving averages, where the buyers and sellers are anticipating a clear breakout or breakdown. Meanwhile, the $57,000 and $58,000 levels may further surface as the key resistances should the $56,800 level come to play. However, a strong bullish spike may take the price to $62,000, $64,000, and $66,000 levels.
Moreover, if the market makes a quick turn to the south, the price of Bitcoin may likely drop to $55,000, and should this support fails to curtail the sell-off, traders may see further drops to $50,000, $48,000, and critically $46,000. The technical indicator RSI (14) is still suggesting an upward movement for the coin as it stays above 55-level.
BTC/USD Medium-Term Trend: Bearish (4H Chart)
The past few trading on the 4-hour chart for BTC is bullish as the market has been showing a strong sign since March 25. Moreover, the intraday trading is now looking bullish; following the recent uptrend to $56,500 which is now a key resistance level. As the coin stays above the 9-day and 21-day moving averages, the next key resistance levels could be located at $58,000, $60,000, and $62,000.
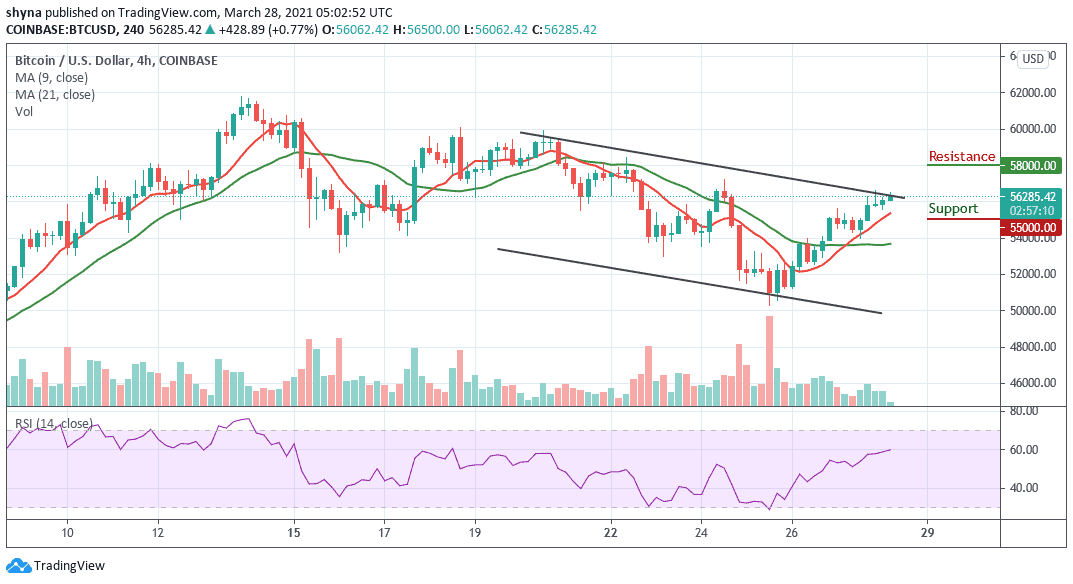
On the downside, the immediate support is near the $55,500 level while the main support is at the $55,300 level. If these supports failed, the coin may likely drop to $55,000 and below. However, the technical indicator RSI (14) is getting ready to cross above 60-level, which indicates that the bullish momentum may continue to play out.
Join Our Telegram channel to stay up to date on breaking news coverage