Join Our Telegram channel to stay up to date on breaking news coverage
LTC Price Prediction – March 22
Today, the Litecoin price drop below the moving averages following the current bearish action in the market.
LTC/USD Market
Key Levels:
Resistance levels: $230, $240, $250
Support levels: $160, $150, $140
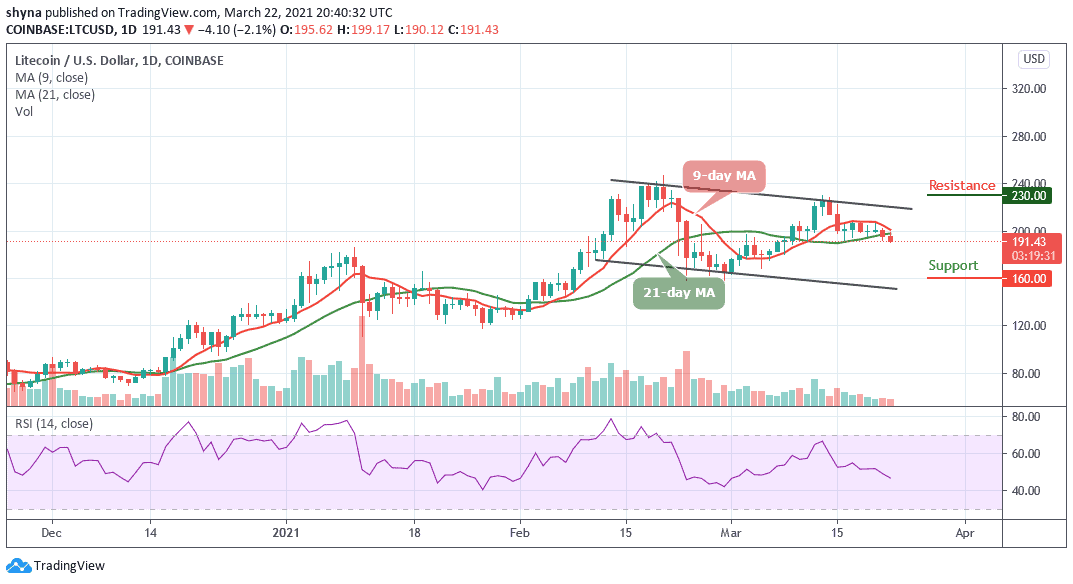
The daily chart reveals that LTC/USD has been recording some losses in 2 days consecutively. LTC/USD begins to follow the bearish trend since March 14 as the cryptocurrency focus on the downtrend. At the time of preparing this article, the Litecoin price is currently trading below the 9-day and 21-day moving averages as the price heads toward the lower boundary of the channel.
What to Expect from Litecoin
As the coin fails to recover from the current trading levels, the more likely it is that traders may see the cryptocurrency fall to a new trading low. A break below the $180 support level may provoke an even deeper decline towards the $160, $150, and $140 levels. The short-term technical analysis shows that the $185 and $183 levels are currently the strongest forms of technical support.
Looking at the daily chart, a break above the moving averages may propel Litecoin to move towards the nearest resistance level of $210 while a further push could take it to a high of $230, $240, and $250 resistance levels. As it stands now, the technical indicator RSI (14) faces the south, crossing below the 45-level, which could cause the market to experience another deep fall.
Comparing with BTC, Litecoin (LTC) is still experiencing another downtrend within the channel, especially in the past few days. The coin recently breaks under solid support at 3500 SAT and continues to fall through subsequent support level to 3450 SAT. The critical support level is located at the 3020 SAT and below.
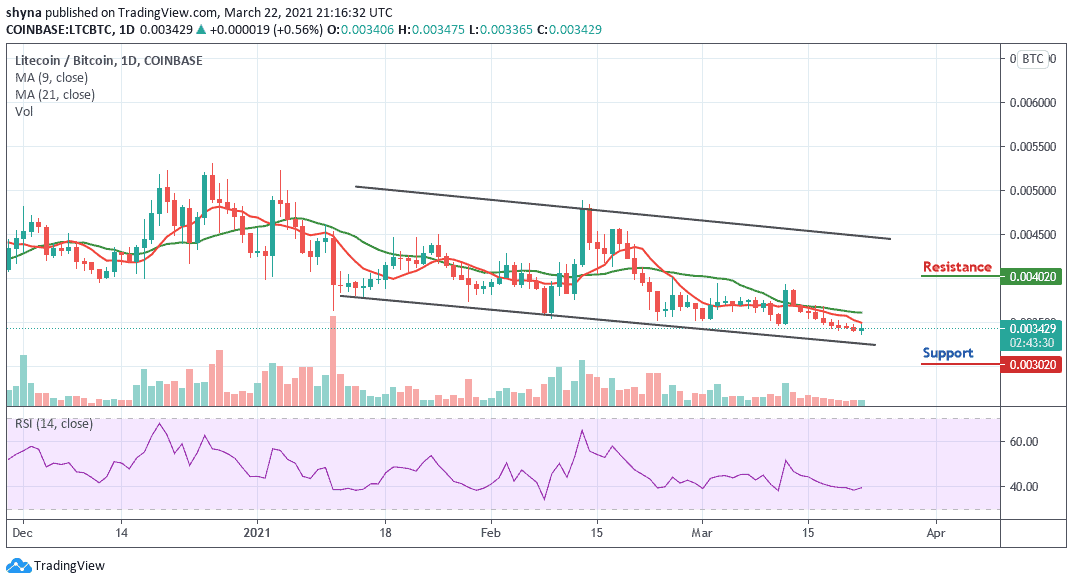
However, if the bulls manage to power the market, we may likely find the resistance level at 4020 SAT and above. Meanwhile, the Litecoin price is currently changing hands at 3429 SAT but a surge in volatility may occur as the RSI (14) may move above the 40-level, which suggests that a bullish trend may play out.
Join Our Telegram channel to stay up to date on breaking news coverage