Join Our Telegram channel to stay up to date on breaking news coverage
Litecoin (LTC) Price Prediction – March 9
Litecoin adds 3.09% in a day, and at the time of writing, it is trading around $197.83.
LTC/USD Market
Key Levels:
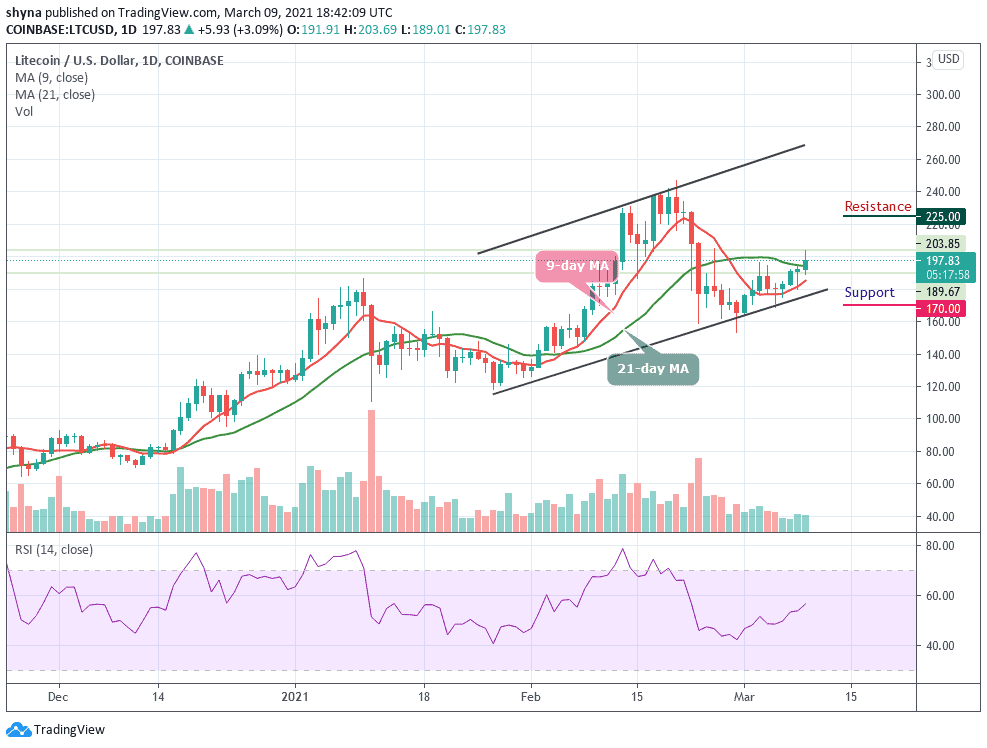
Resistance levels: $225, $235, $245
Support levels: $170, $160, $150
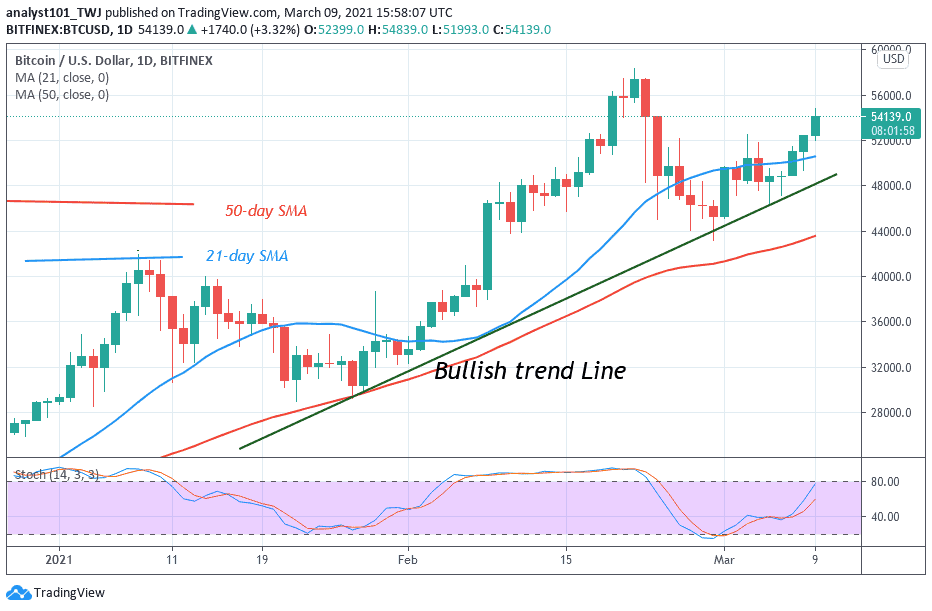
LTC/USD has been able to fetch a decent hike in the last few days that took the coin near $200 after a while. The coin is already on a path of price recovery after the drops of two days of the last week. LTC is likely to touch $210 in the coming days as its next resistance. The long-term outlook may continue to be bullish.
What to Expect from Litecoin (LTC)
As the trading volume is coming up gradually, the coin is trading above the 9-day and 21-day moving averages within the ascending channel.On the upside, if the price stays above the moving averages, LTC may likely continue its uptrend and could touch the resistance levels of $225, $235, and $245.
However, as the market follows the uptrend, there is the tendency of the bears breaking below the moving averages to touch the support of $180. Nevertheless, the technical indicator RSI (14) is trading above the 55-level but if the signal line turn downward, bears step back into the market as the nearest support levels lie at $170, $160, and $150 respectively.
When compares with BTC, the Litecoin price is moving in sideways below the 9-day and 21-day moving averages. The number nine crypto on the market cap is yet to define its real direction because the market movement has remained clouded by bearish prices for the past few days.
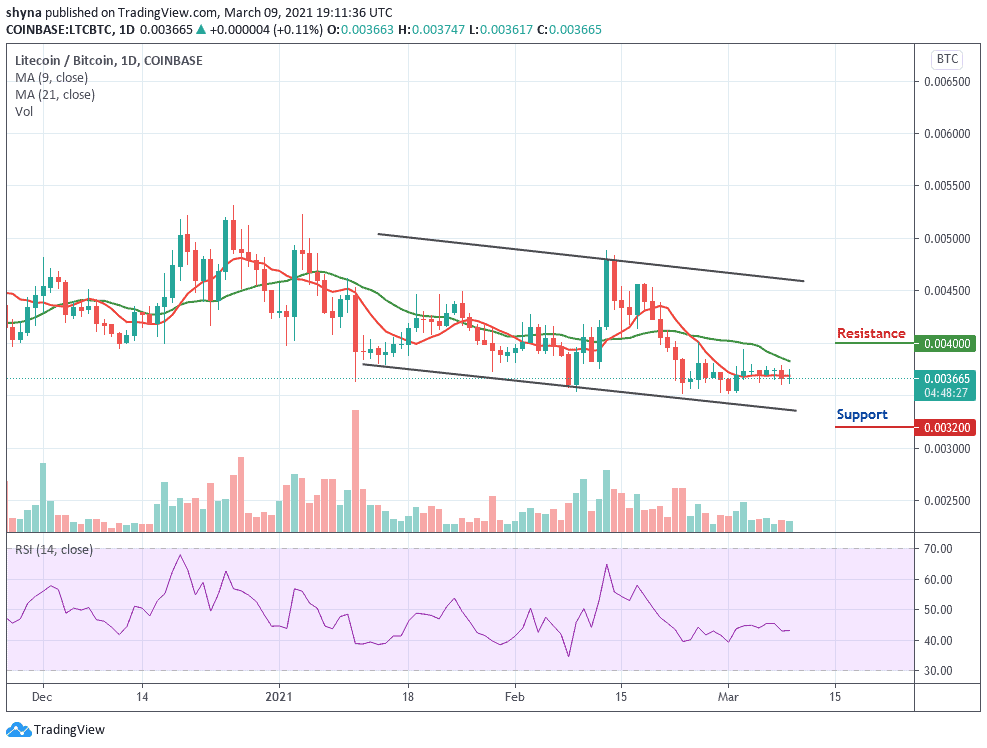
However, as the technical indicator RSI (14) moves in the same direction above the 40-level, the market may likely move sideways with a possible break down and further declines could be at 3200 SAT and below, establishing a new low for the coin. Meanwhile, any bullish movement above the moving averages could push the coin towards the resistance level of 4000 SAT and above.
Join Our Telegram channel to stay up to date on breaking news coverage