Join Our Telegram channel to stay up to date on breaking news coverage
Litecoin (LTC) Price Prediction – February 28
Litecoin absorbs losses with a sharp drop from the $171 level. All technical levels have become negative in the face of the increased volatility of the crypto.
LTC/USD Market
Key Levels:
Resistance levels: $210, $220, $230
Support levels: $120, $110, $100
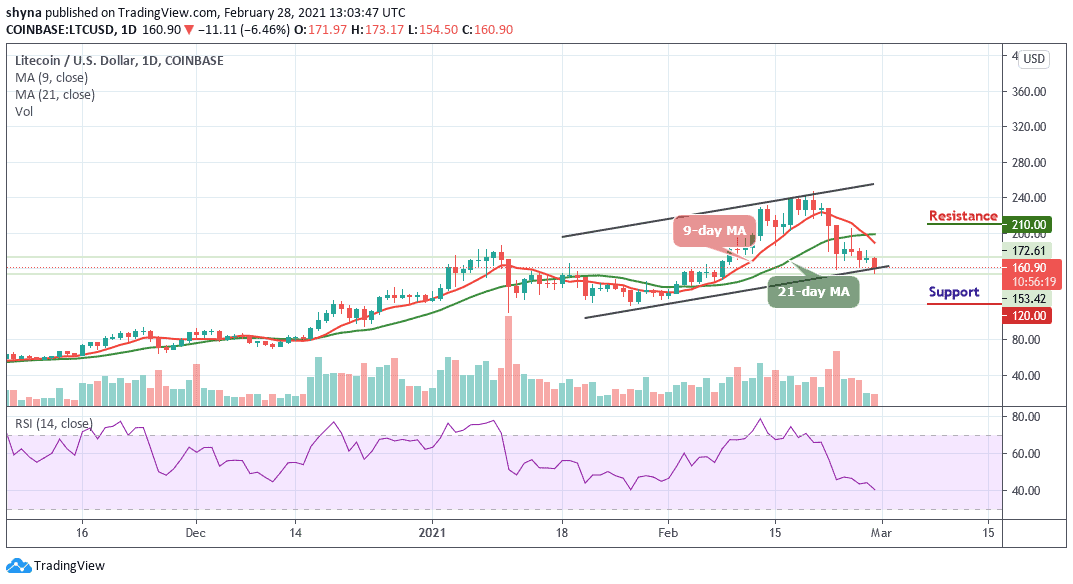
LTC/USD is nursing losses with a sharp drop from $173 to lows almost risking breaking $155. Looking technically, a sustainable move below $130 handle bodes ill for Litecoin bulls. If they failed to push the price back above the 9-day moving averages, the downside pressure is likely to increase.
Where is LTC Price Going Next?
Looking at the chart, it can be seen that Litecoin could not exceed the $170 level at the moment and had fallen to a support level of $154. The price then is recovering from here, but still struggles to make any movement to the upside. Therefore, if the price goes up a bit, the resistance level could be $210, $220, and $230. On the downside, the seller can find support at $120, $110, and $100 as the technical indicator RSI (14) is making an attempt to cross below the 40-level.
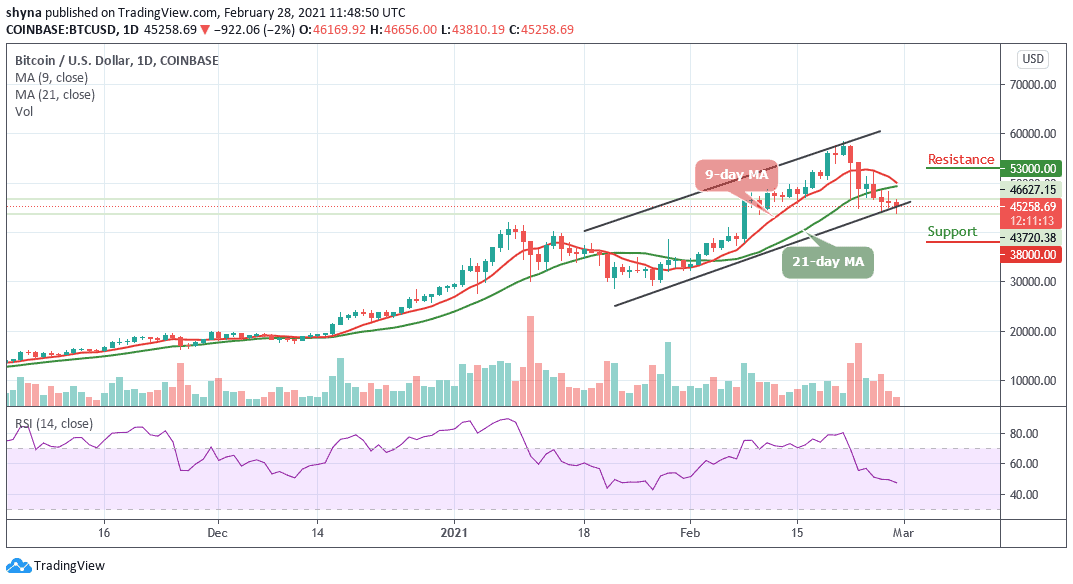
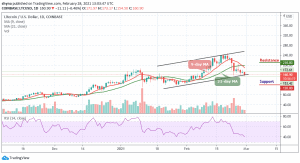
Against Bitcoin, the Litecoin price continues to follow a bearish sentiment for over a week as the coin suffers a serious downtrend pressure from Bitcoin. If the bulls attempt to gain momentum, the bears are likely to keep releasing huge pressure on the market. Meanwhile, as the 9-day MA crosses below the 21-day MA, the Litecoin will continue to trade at the negative side as the coin could hit the nearest support at 3500 SAT. Any further bearish movement may locate the critical support at 3200 SAT and below.

On the other hand, the closest resistance level is found above the 9-day moving average at 3900 SAT. More so, the additional resistance is found at 4100 SAT and above. Meanwhile, the technical indicator RSI (14) is likely to cross below the 40-level, giving bearish signals, which may suggest that the recent recession could probably continue to fall.
Join Our Telegram channel to stay up to date on breaking news coverage