Join Our Telegram channel to stay up to date on breaking news coverage
Bitcoin (BTC) Price Prediction – February 28
The Bitcoin price begins a fresh decline after it failed to clear $46,000 as it remains at a risk of a drop towards $41,000.
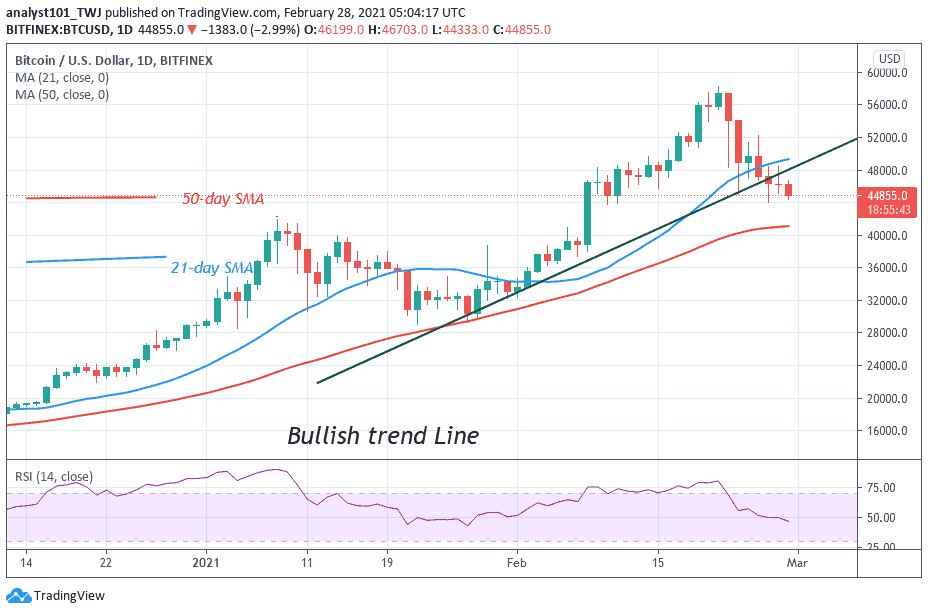
BTC/USD Long-term Trend: Bullish (Daily Chart)
Key levels:
Resistance Levels: $53,000, $55,000, $57,000
Support Levels: $38,000, $36,000, $34,000

BTC/USD is beginning to experience downward pressure in the short term, as buyers struggle to move the cryptocurrency to new highs. However, the cryptocurrency now moves below the 9-day and 21-day moving. The current market scenario is indicating a bearish trend moving below the lower boundary of the channel.
Would Bitcoin Go Up or Down?
Bitcoin could plunge below $45,000 support and is Bitcoin finally leaving the significant support level and searching for new lows? Following a bearish sentiment, Bitcoin price has drastically dropped in the past few days of trading due to the selling pressure in the market. Technically, the king coin is yet to exhaust the momentum while the RSI (14) is still moving down. However, a significant rise above the potential resistance may set a bullish reversal for the market
As of writing this, Bitcoin is struggling to maintain the $45,000 support level. If the coin fails to do so, then the next support levels are likely to be $38,000, $36,000, and $34,000. From above, maintaining the $45,000 level could send Bitcoin to retest old support turned resistance levels at $50,000. The further movement could go above the significant 9-day and 21-day moving averages, which could send the price to $53,000, $55,000, and $57,000 resistance levels.
BTC/USD Medium-Term Trend: Bearish (4H Chart)
According to the 4-hour chart, the bears have dominated the market, and the price slides below the 9-day and 21-day moving averages heading towards the south. However, if the price moves toward the descending channel and continues to fall, the support levels of $40,000 and below may come into play.
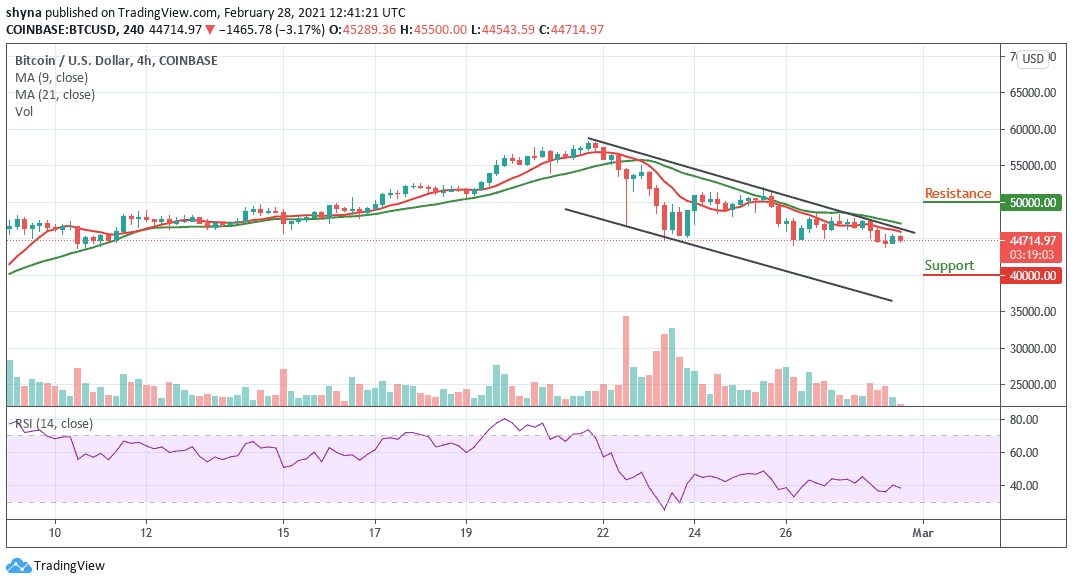
Meanwhile, as the RSI (14) moves below 40-level, on its way back to the top, the buyers could gather enough momentum to fuel the market and they may push the price above the moving averages where it could hit the targeted resistance levels of $50,000 and above.
Join Our Telegram channel to stay up to date on breaking news coverage