Join Our Telegram channel to stay up to date on breaking news coverage
LTC Price Prediction – February 22
Litecoin market witnesses a serious drop today, amounting to a 9.59% loss with a current trading price of around $205.
LTC/USD Market
Key Levels:
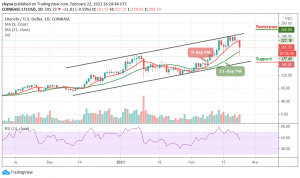
Resistance levels: $260, $270, $280
Support levels: $160, $150, $140

LTC/USD is currently changing hands at $205.73, down with a 9.59% loss. The coin is now recovering from the intraday low of $179, but the upside momentum is quite slow. However, if the market reclaims the positive momentum, the Litecoin price would continue to respect the channel pattern. Otherwise, more breakdowns may likely play out in the market.
Where is LTC Price Going Next?
The Litecoin (LTC) is seen trading within the 9-day and 21-day moving averages. However, a possible retracement below the moving averages may drag the price to the supports level of $160, $150, and $140 supports, creating a new monthly low. Therefore, if the buyers can decide to move the market price back above the 9-day moving average, buying pressure may experience further bullish movements to the potential resistance at the $240 and $250.
Meanwhile, as it appears now, there’s a need for a pullback for the market to regain strength. Moreover, a sustainable move above the upper boundary of the channel is needed for the upside to gain traction with the next focus on $260, $270, and $280 resistance levels. The technical indicator RSI (14) is moving below the 60-level, suggesting more bearish signals into the market.
When compares with Bitcoin, the Litecoin price is following a bearish sentiment now as the coin suffers a vast downtrend pressure from Bitcoin. However, if the bulls attempt to gain momentum, the bears are likely to keep releasing a huge pressure on the market as the technical indicator RSI (14) heads to the south, seeing the signal line falling below the 45-level.
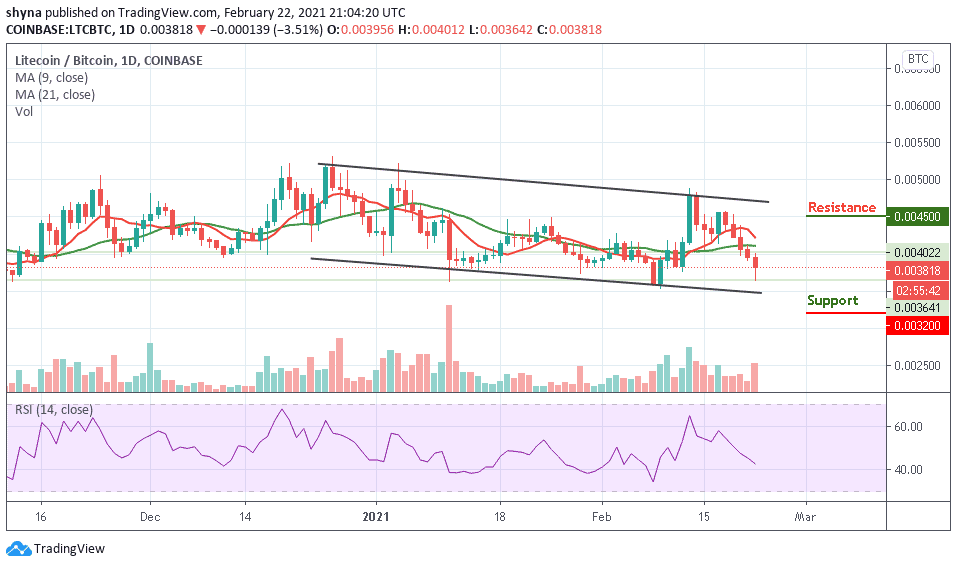
Moreover, if the Litecoin stays below the 9-day and 21-day moving averages, it could significantly lower the price to 3200 SAT and below. In case of a rebound, the coin can test the 4400 SAT above the moving averages before resuming the rally. If the bulls can manage to stay well above this level, traders could see a bull-run to the resistance level of 4500 and above.
Join Our Telegram channel to stay up to date on breaking news coverage