Join Our Telegram channel to stay up to date on breaking news coverage
Litecoin (LTC) Price Prediction – February 19
Litecoin adds a tremendous 4.89% gain today, and at the time of writing, it is trading around the $234.73 resistance level.
LTC/USD Market
Key Levels:
Resistance levels: $270, $280, $290
Support levels: $195, $185, $175
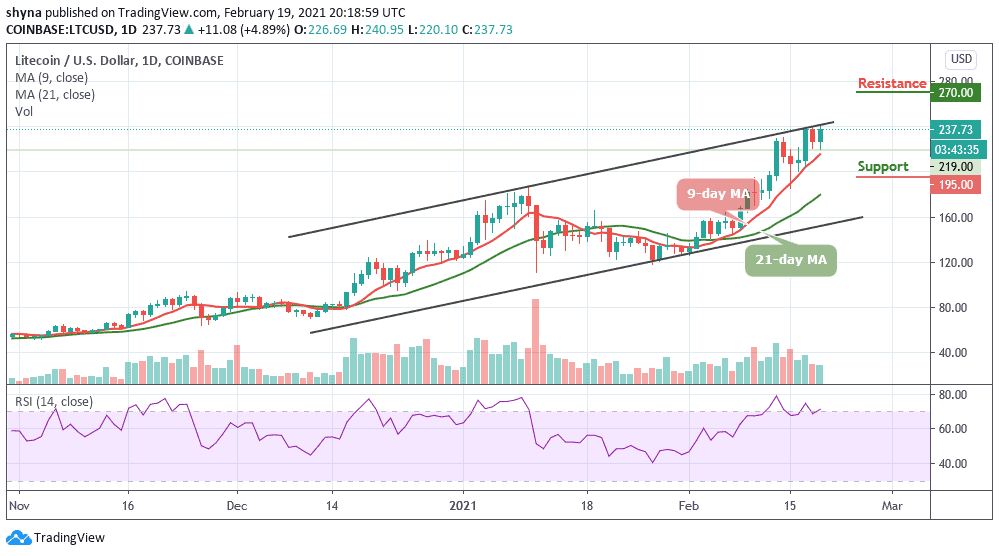
LTC/USD is seen fetching a decent hike in the last 24 hours that took the coin above the $235 level. The coin is already following bullish movements, trading above the 9-day and 21-day moving averages. Meanwhile, LTC/USD is one of the most emerging coins of the market at the moment, and it is likely to touch $250 in the coming days as its next resistance. The long-term outlook may continue to be bullish.
Will LTC Break Through Resistance Level of $250 or Reverse?
As the daily chart reveals, the Litecoin price is trading above the 9-day and 21-day moving averages within the ascending channel. On the upside, if the price breaks above the upper boundary of the channel and closes above it, LTC/USD may likely continue its uptrend and could reach the resistance levels of $270, $280, and $290.
In other words, if the technical indicator failed to remain within the overbought region, there is the tendency of the bears to return into the market and this may likely cause the market price to hit the nearest support levels at $195, $185, and $175 respectively. Technically, the RSI (14) is crossing above the 70-level, suggesting additional bullish signals.
Against Bitcoin, the Litecoin price keeps moving sideways, trading below the 9-day moving average. Should in case a trend rebounds, there could be an upsurge in the market. Now, the coin is trading around the 4304 SAT, crossing below the moving averages may cause it to hit the support at 3800 SAT and below.
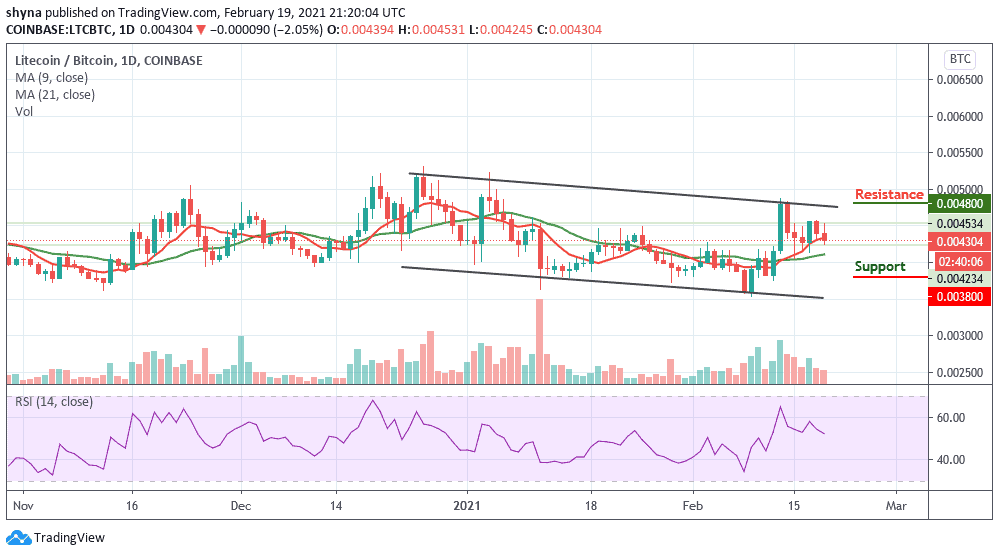
However, if a bullish move occurs and validates a break above the upper boundary of the channel, the price may likely hit the potential resistance at 4800 SAT and above. Meanwhile, the RSI (14) is seen moving below the 55-level to increase the bearish momentum.
Join Our Telegram channel to stay up to date on breaking news coverage