Join Our Telegram channel to stay up to date on breaking news coverage
LTC Price Prediction – September 7
The Litecoin price is locked in a tight range below $50 as it is up with 0.96% since the beginning of the day.
LTC/USD Market
Key Levels:
Resistance levels: $56, $58, $60
Support levels: $38, $36, $34
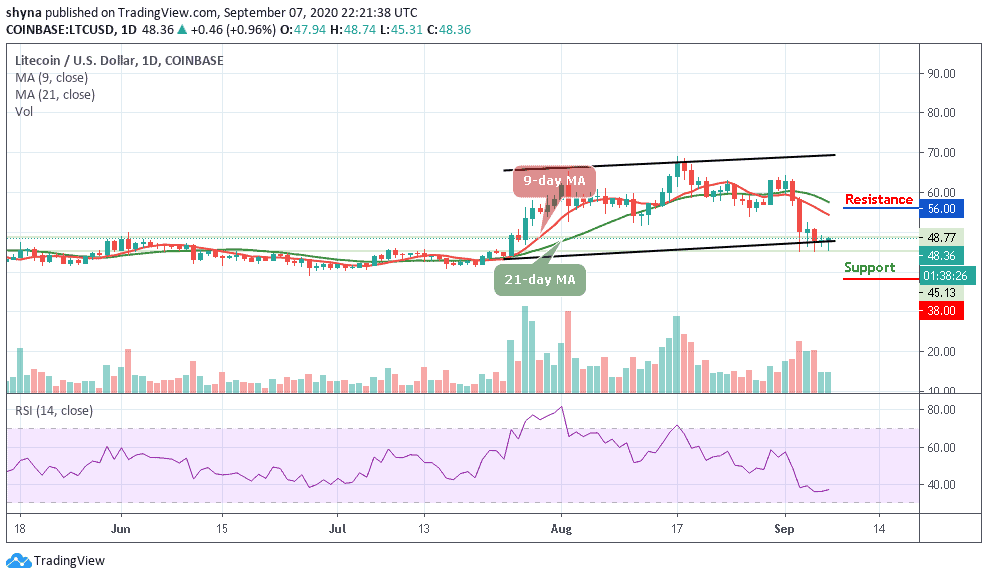
On the daily chart, LTC/USD is hovering around the lower boundary of the channel at $48.36. If the price extends the decline below this level, this barrier may slow down the short-term bears as it has served as a backstop since the beginning of the week. If the sell-off gains traction, LTC may retreat towards a psychological $45. The next strong support may come at $38, $36, and $34, which is the lowest level in the new month.
Will LTC Break Through the Resistance Level of $52 or Reverse?
On the upside, traders will need to see a sustainable move above $50 to improve the short-term technical picture. This barrier could be reinforced by the 9-day and 21-day moving averages. Once it is out of the way, the upside is likely to gain traction with the next focus on $52 and $54 resistance levels.
However, any further bullish movement may likely push the coin towards the potential resistance levels of $56, $58, and $60 respectively. More so, the RSI (14) on the daily chart is flat in the neutral position below the 40-level, which means that short-term range-bound trading may prevail at this stage.
Against with Bitcoin, the Litecoin price has been experiencing some difficulties since the beginning of this month as the coin exploded under the solid support of 4700 SAT below the 9-day and 21-day moving averages, LTC/BTC continued to fall towards 4600 SAT. The critical support level is located below the channel at 4300 SAT and below.
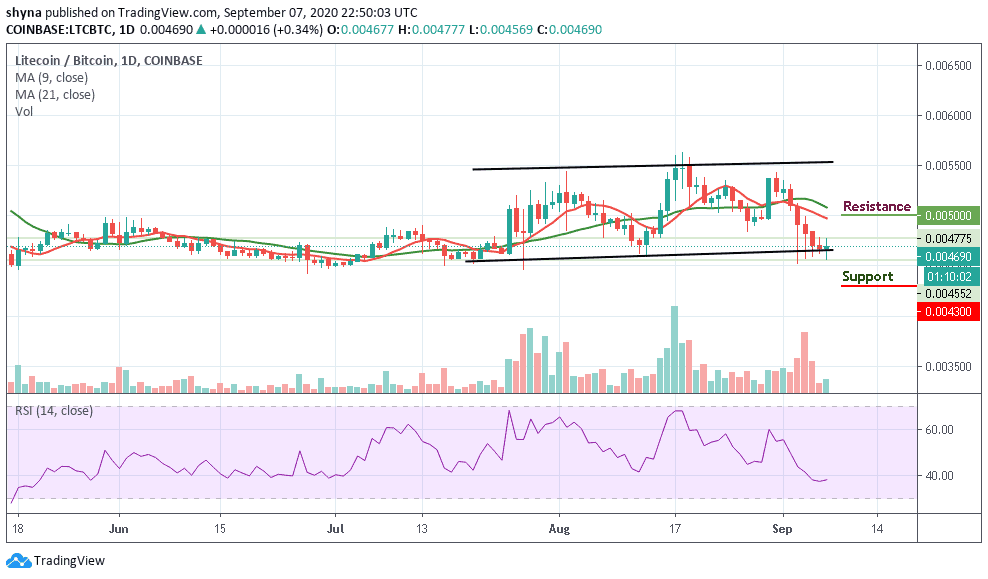
However, any attempt by the bulls to move the market higher to cross the moving averages may likely meet the potential resistance at 5000 SAT and above. Meanwhile, looking at the daily chart, the RSI (14) is seen moving below 40-level, suggesting more sideways movement.
Join Our Telegram channel to stay up to date on breaking news coverage