Join Our Telegram channel to stay up to date on breaking news coverage
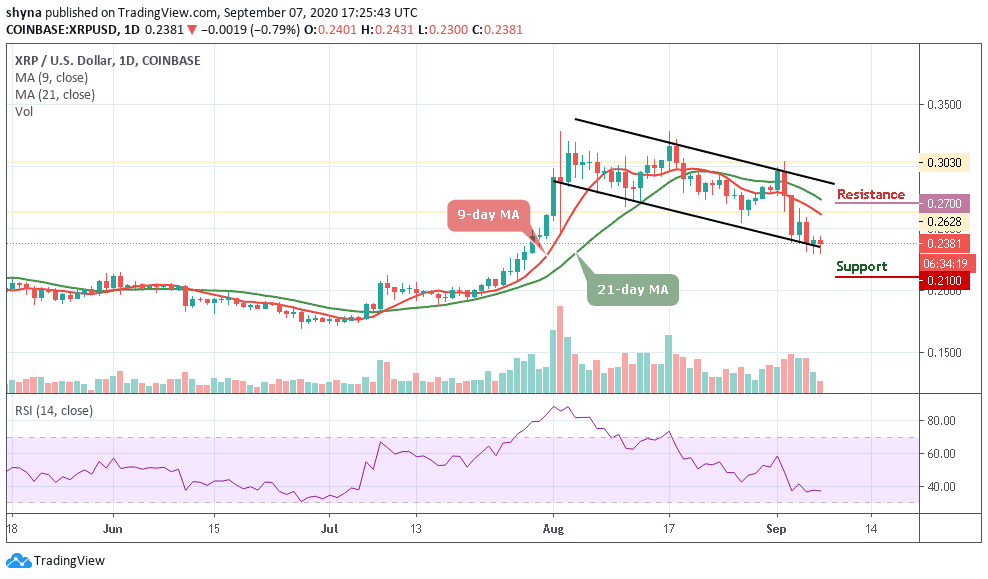
Bitcoin (BTC) Price Prediction – September 7
Despite several sell-off attempts, BTC/USD is seen settling above $10,000.
BTC/USD Long-term Trend: Ranging (Daily Chart)
Key levels:
Resistance Levels: $10,900, $11,100, $11,300
Support Levels: $9,300, $9,100, $8,900
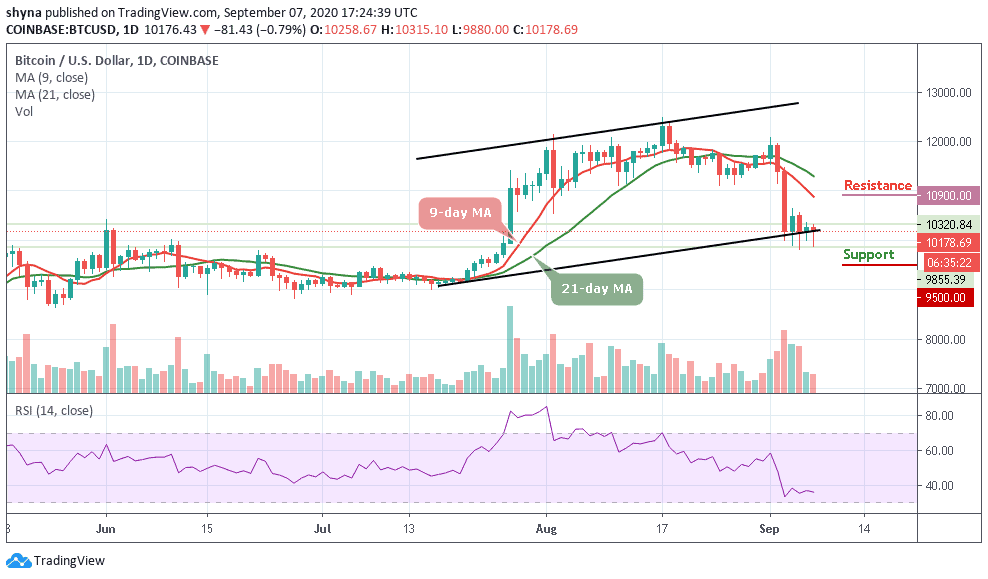
BTC/USD has started the week in a tight channel limited by $9,800 on the downside and $10,360 on the upside. At the time of writing, BTC/USD is changing hands at $10,178 with 0.79% losses. However, BTC/USD has been relatively stable, moving in a tight range with strong support at $10,000 and looking very likely that it may break down to $9,500 soon to close it off. This anticipation of more downside in the short-term has been reflected by the global crypto market capital, which has fallen in the last 24 hours.
What to Expect from Bitcoin (BTC)
The daily chart implies that BTC/USD is still vulnerable to the further decline towards the support of $9,000. A sustainable move below $10,000 and $9,800 may open up the way for a deeper plunge and confirm the bearish scenario for the days ahead. On the other hand, the resistance level of $10,500 may create the initial resistance that needs to be taken out to improve the immediate technical picture.
Once this happens, a more substantial barrier of $10,900, $11,100, and 11,300 resistance levels may come into focus. However, looking at the RSI (14) in the daily range, as the signal line is moving below 40-level, BTC/USD is likely to move sideways. If the Bitcoin price drops below this level, then, the critical supports at $9,500, $9,300, and $9,100 could be visited.
BTC/USD Medium – Term Trend: Bearish (4H Chart)
Looking at the 4-hour chart, it’s clear that the current price action is tracking inside a down-trending channel, with two strong resistance areas above the $10,180 and $10,000 levels. The $10,300 level stays above the 9-day and 21-day moving averages, this could make that particular area even more difficult to break above.
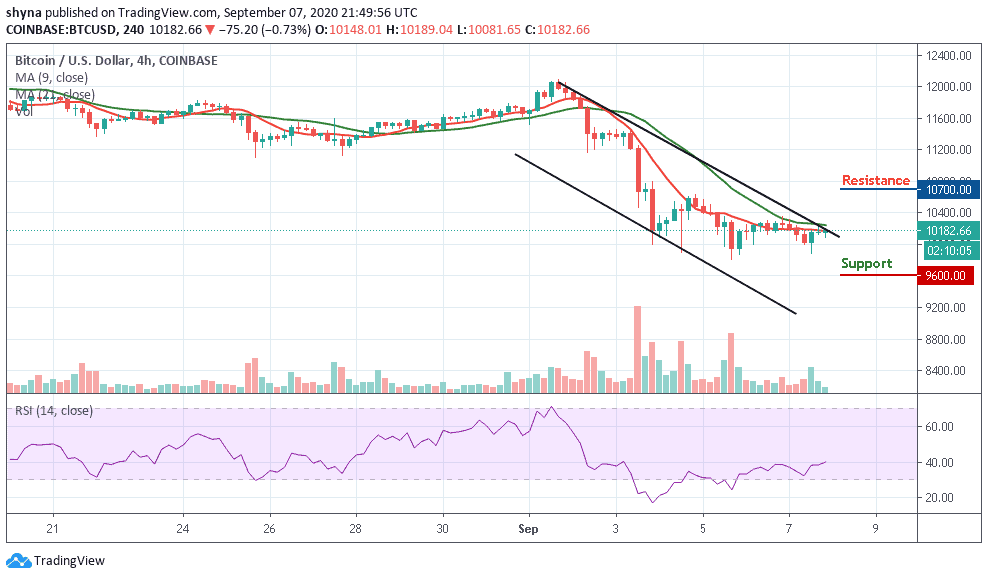
However, the RSI (14) is moving below the 40-level, staying there could create some friction if Bitcoin reverses. The Bitcoin price has been making consistently lower lows and looking further down, the market may hit the nearest support at $9,800. If the Bitcoin price crashes further, the support level of $9,600 and below may play out.
Join Our Telegram channel to stay up to date on breaking news coverage