Join Our Telegram channel to stay up to date on breaking news coverage
LTC Price Prediction – November 30
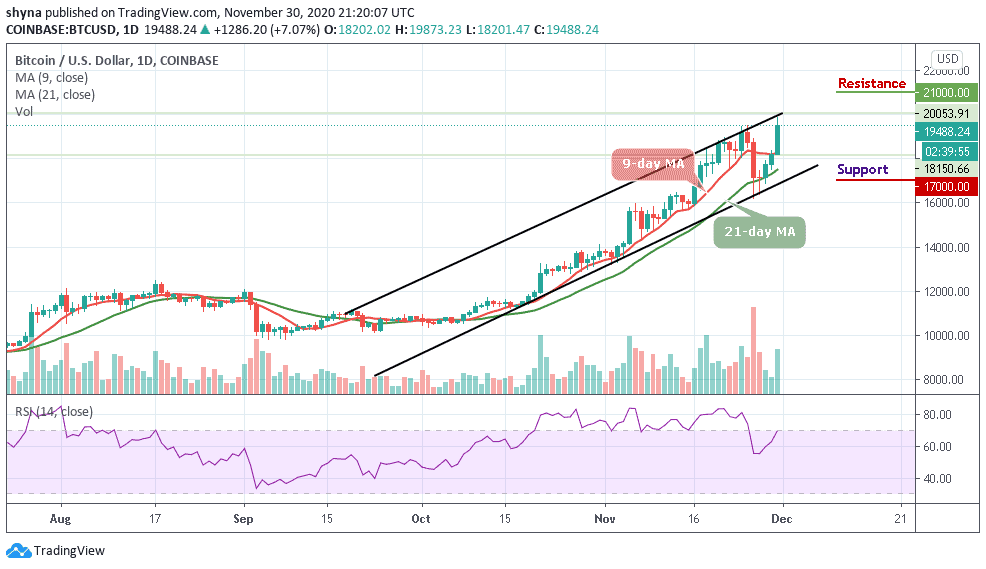
LTC/USD may continue to set a bullish run if the market can climb back above the $90 resistance level.
LTC/USD Market
Key Levels:
Resistance levels: $95, $100, $105
Support levels: $70, $65, $60
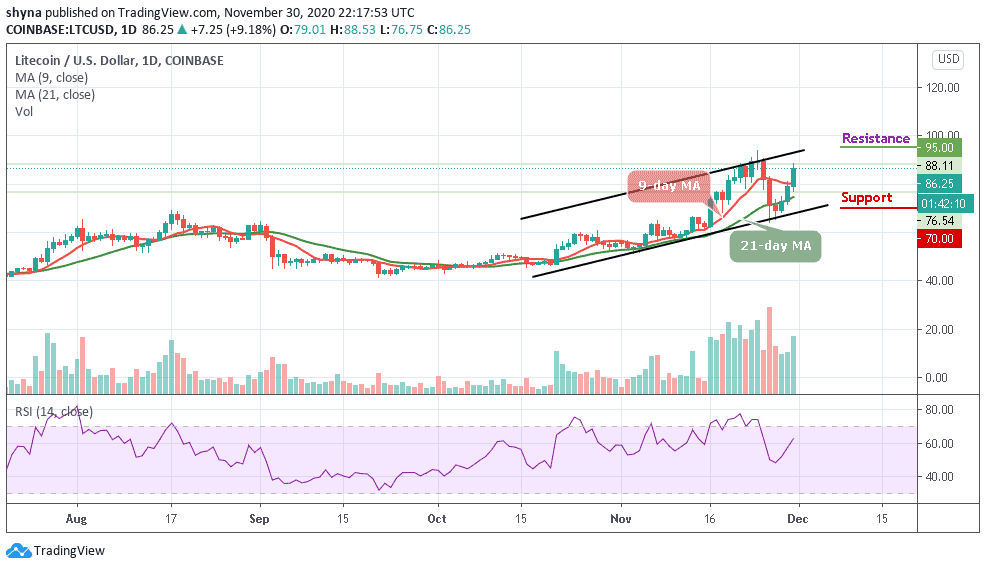
According to the daily chart, LTC/USD is currently showing a positive movement over the past few hours. The market is actually running a little retracement move towards $90 with price growth of 9.18%. Apart from today’s gain, Litecoin (LTC) is still maintaining an upward movement within the channel and traders can expect the price to continue to rise as soon as the bulls put more pressure on the market.
What to Expect from Litecoin (LTC)
If the price can keep respecting the upward movement, we can then expect a bullish continuation after testing the $75 support. As the technical indicator, RSI (14) crosses above the 9-day moving average; the potential resistance levels are located at $95, $100, and $105 in the long-term.
However, should in case the coin continues to maintain the rising channel pattern, traders may witness a more bullish trend. Meanwhile, looking at the price formation, a bearish breakout may likely play out for this market and this could roll the coin back to the long-term support at $70, $65, and $60 levels. Therefore, a continuous fall might further lead to a violent break below $55.
Against Bitcoin, the buyers are gradually stepping back into the market as the coin is trying to show some promising signs that could make higher highs should it continue to move above the 9-day and 21-day moving averages. From the upside, the nearest level of resistance lies at 4800 SAT and above this, higher resistance lies at 5000 SAT and 5200 SAT.
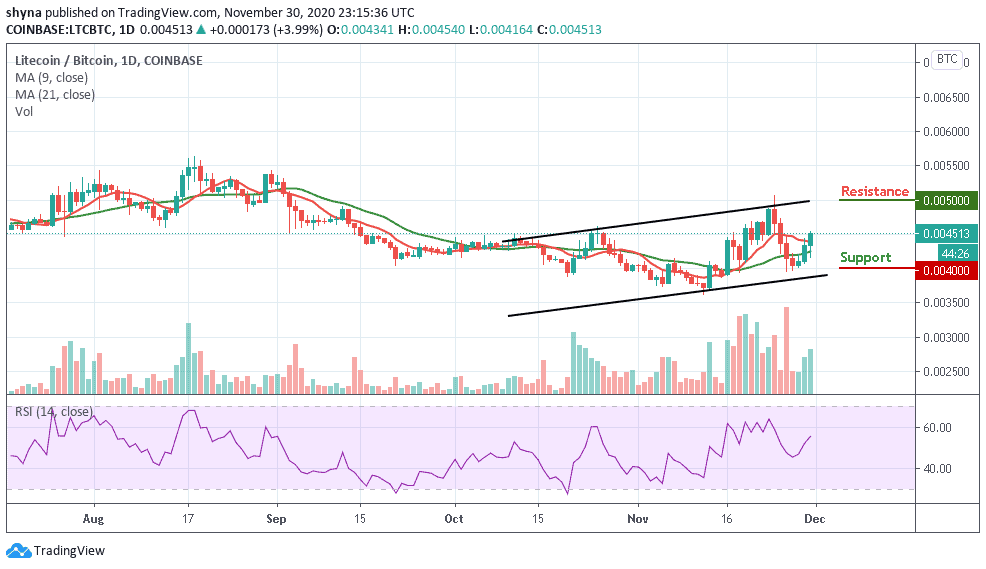
In other words, from the downside; the nearest support level is below the moving averages at 4100 SAT and beneath this, further support lies at 4000 SAT. If the price drops further to create additional low, lower support may be located at 3800 SAT and 3600 SAT. The RSI (14) has already crossed above the 50-level which shows that the bulls are building up.
Join Our Telegram channel to stay up to date on breaking news coverage