Join Our Telegram channel to stay up to date on breaking news coverage
Bitcoin (BTC) Price Prediction – November 30
BTC/USD is on track for having a fourth bullish day in a row as the bulls took the price up from $18,200 to $19,873.
BTC/USD Long-term Trend: Bullish (Daily Chart)
Key levels:
Resistance Levels: $21,000, $21,200, $21,400
Support Levels: $17,000, $16,800, $16,600
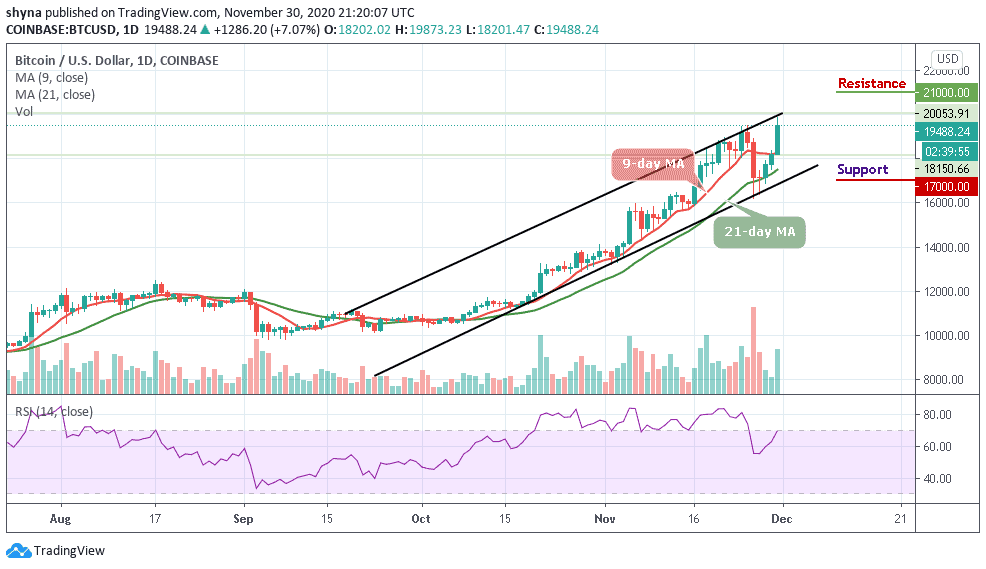
BTC/USD movement on the daily chart is reflecting a tremendous improvement. However, if the bulls keep and maintain the uptrend, then the expectation of recovery could turn out to be true. The Bitcoin price is seen trading at $19,488 after soaring to $19,873 and may continue to head downwards if the bears step back into the market.
Where is BTC Price Going Next?
The market is deciding around $19,488 around the upper boundary of the channel, where the buyers are anticipating a clear breakout. However, a strong bullish spike above the upper boundary of the channel may likely take the price to the resistance levels of $21,000, $21,200, and $21,400.
Moreover, if the market decides to follow the downward trend, Bitcoin’s price may likely drop to the nearest support at $18,200, and should this support fails to contain sell-off, traders may see another drop to the critical supports at $17,000, $16,800, and $16,600.
Meanwhile, the technical indicator RSI (14) reveals that the coin may still be in the bullish movement mode in as much as the signal line is likely to move into the overbought territory. Turning downward may result in immediate supports.
BTC/USD Medium-Term Trend: Bullish (4H Chart)
Bitcoin price surged upwards within 24 hours, catapulting its price over $19,200 to reach where it currently trades at around $19,426. This sudden rise also pushed the price overall other altcoins, which increased by more than 6.72% in the respective period. However, the closest resistance levels lie at $20,800 and $21,000, while the nearest supports are $18,200 and $18,000 respectively.
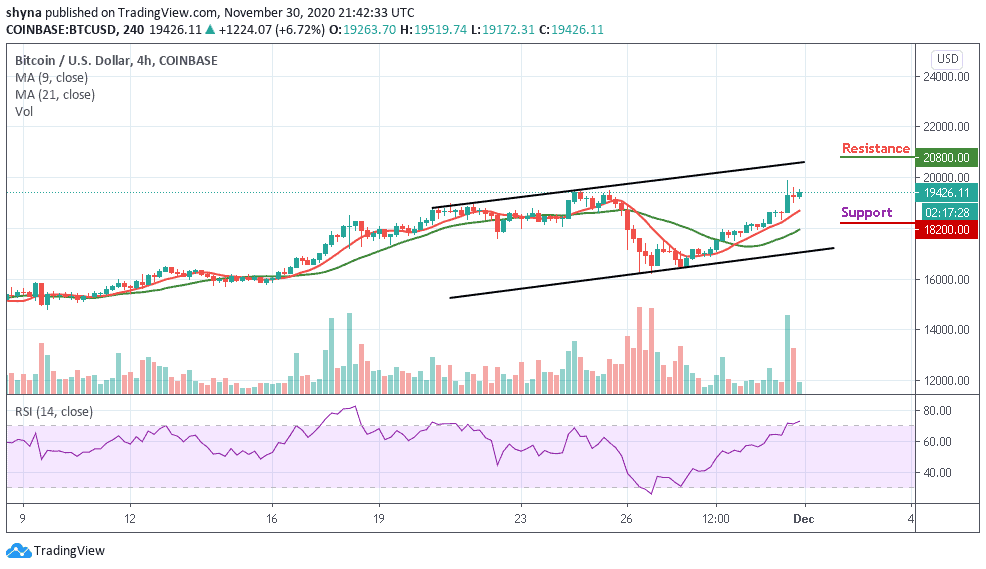
In addition, as the coin moves above the 9-day and 21-day moving averages, the technical indicator is looking bullish and still flashing buy signals. After recording its lowest since November 27, the RSI (14) indicator is moving into the overbought region, which indicates a bullish movement at the moment.
Join Our Telegram channel to stay up to date on breaking news coverage