Join Our Telegram channel to stay up to date on breaking news coverage
XRP Price Prediction – November 30
The price of Ripple is at the upside as the price movement of Bitcoin, which is also seen spiking and regaining its lost position.
XRP/USD Market
Key Levels:
Resistance levels: $0.78, $0.79, $0.80
Support levels: $0.48, $0.47, $0.46
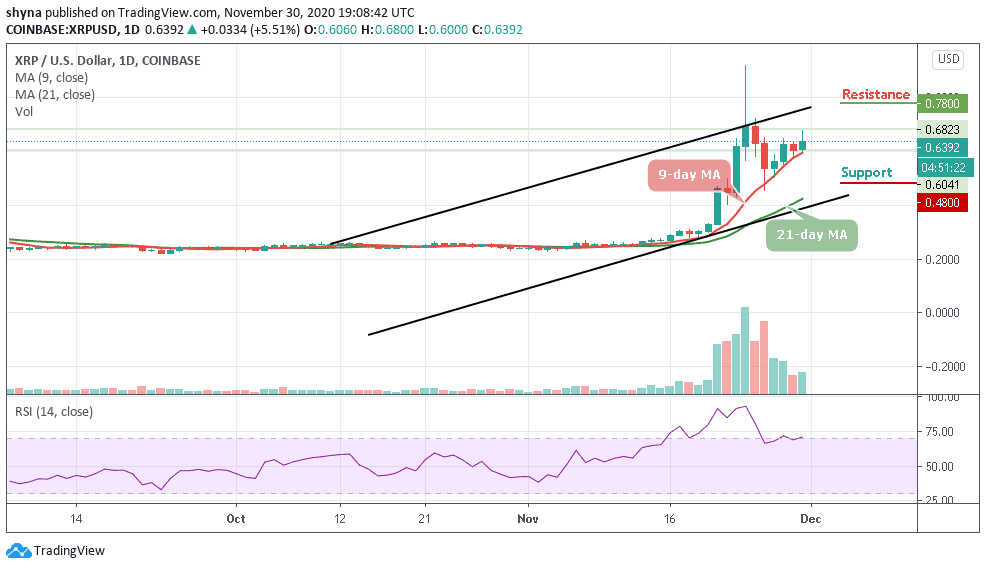
XRP/USD bulls are in control of the market as the price rises from $0.606 to $0.680 above the 9-day and 21-day moving averages. However, the technical indicator RSI (14) is seen moving within the overbought region. This indicates that the daily trend is still bullish while the overall market sentiment may move sideways.
What to Expect from Ripple (XRP)
At the time of writing, XRP/USD is trading at $0.639 after touching the high of $0.680. A building bullish momentum suggests that XRP could continue to scale the levels towards $0.70 critical resistance. From a technical point of view, the price is currently in the hands of the bulls as observed by the technical indicator which is hovering above the 70-level. Meanwhile, as the RSI (14) remains at the upside, the bullish grip may continue to strengthen.
However, the nearest resistance for the market is located at $0.78, $0.79, and $0.80. As it appeared on the daily chart, there’s no sign of a decisive move at the moment. However, if the $0.55 support gets weak, a price break-down may occur as the bears may find additional low at $0.48, $0.47, and $0.46 support levels.
Against Bitcoin, the pair is consolidating within the channel and moving above the 9-day and 21-day moving averages. Meanwhile, the buyers have been trying to push the price above the channel so as to take it to the resistance levels of 4000 SAT and above.
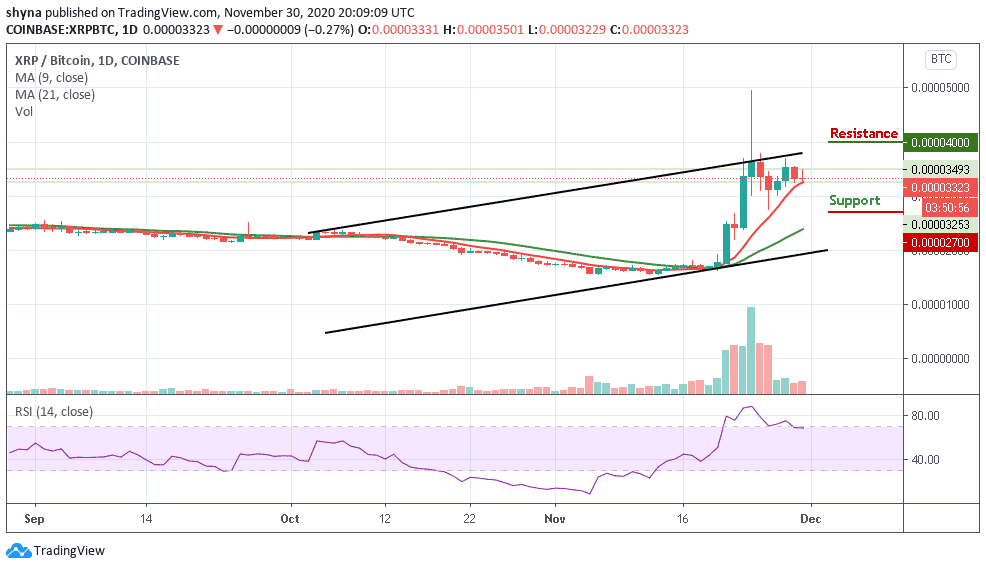
Looking at the daily chart, if the bulls failed to hold the price, then XRP/BTC may experience more downtrends and the nearest support levels for the coin are located at 2700 SAT and 2800 SAT. Meanwhile, the technical indicator RSI (14) moves above 70-level, which indicates more bullish signals.
Join Our Telegram channel to stay up to date on breaking news coverage