Join Our Telegram channel to stay up to date on breaking news coverage
LTC Price Prediction – November 29
Litecoin (LTC) gains 1.91% as the market opens and touches a $75.18 daily high. It may find the next resistance at $80.
LTC/USD Market
Key Levels:
Resistance levels: $88, $90, $92
Support levels: $60, $58, $56
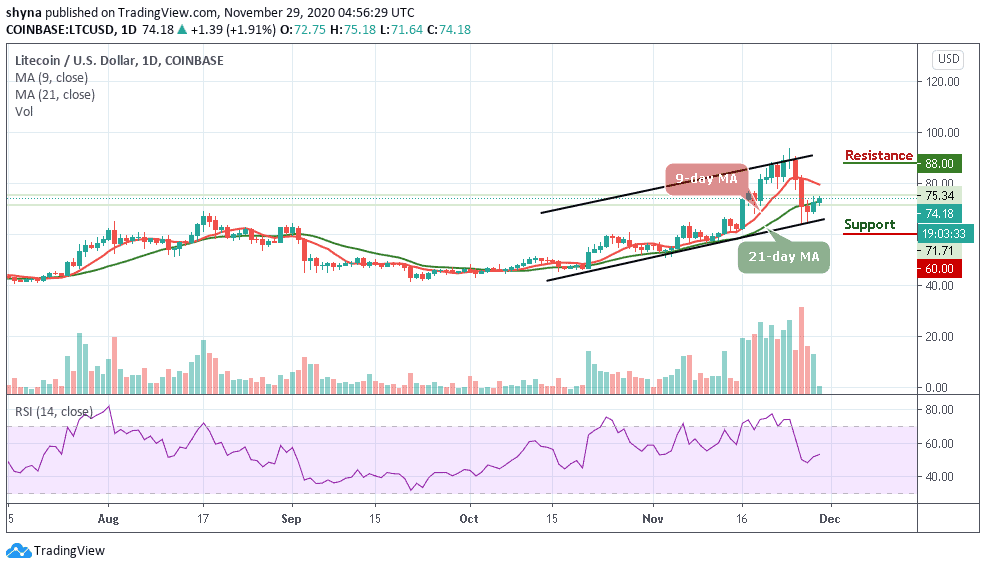
LTC/USD is trading in the green in today’s session, trading above the 21-day moving averages where the coin gains around 1.91%. LTC/USD bulls broke out from the downside after touching the low of $64.30 a few days ago. However, the coin is currently hovering around the $75.18 level within the ascending channel.
What to Expect from Litecoin (LTC)
The current price of Litecoin at $75 is within the moving averages of 9 and 21 days as the recovery seems to have started. The cryptocurrency needs to continue its up-trending growth in the coming days to recover properly. As per the current trend, the next resistance level is likely at the $80 resistance level. However, the market price could move towards the upper boundary of the channel to hit the resistance at $88, $90, and $92 levels.
On the downside, a sustainable move below the lower boundary of the channel may open up the way to a $63 support level. Moreover, this barrier is likely to slow down the bears and serve as a jumping-off ground for the recovery. The next support levels are located at $60, $58, and $56 respectively but the RSI (14) is moving above the 50-level, suggesting more bullish signals.
Comparing with Bitcoin, Litecoin price is making an attempt to cross above the 9-day moving average for the nearest resistance level of 4300 SAT to be visited. Unless this resistance is effectively breached and the price ends up closing above it, there might not be any reason to expect the long-term bullish reversal.
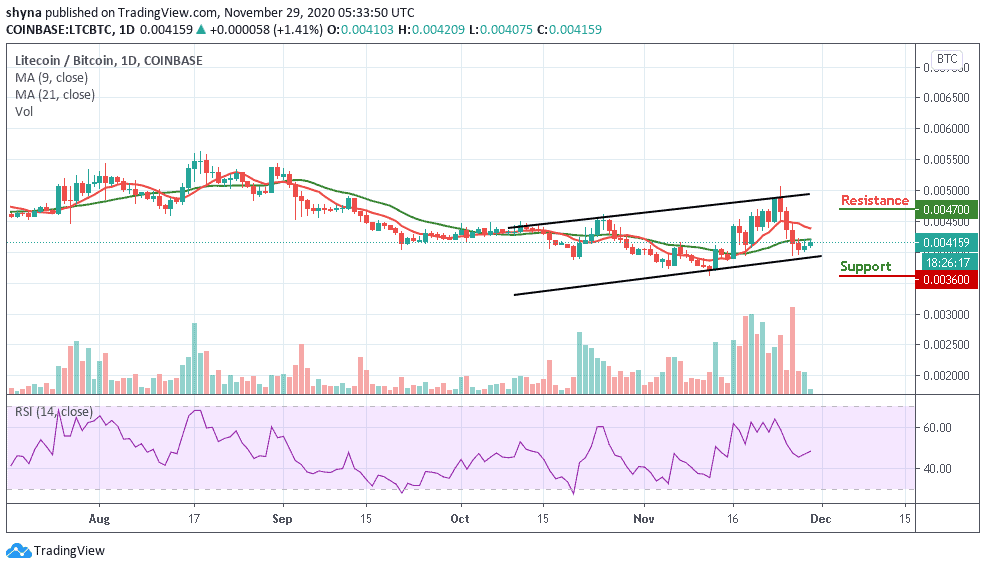
However, trading below the lower boundary of the channel, the bear could hijack the market movement and a possible bearish continuation may likely meet the major support at 3800 SAT before falling to 3600 SAT and below. But as it stands now, if the buyers could put more effort, they may push the market price to the potential resistances at 4700 SAT and above while the RSI (14) indicator made a sharp return above 45-level to confirm the bullish movement.
Join Our Telegram channel to stay up to date on breaking news coverage