Join Our Telegram channel to stay up to date on breaking news coverage
Bitcoin (BTC) Price Prediction – November 29
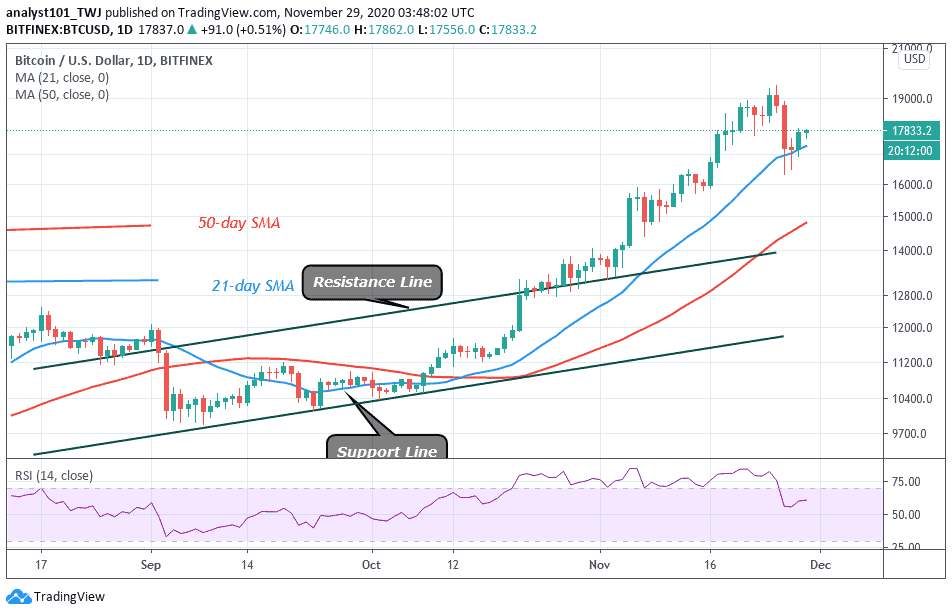
According to the daily chart, the Bitcoin (BTC) remains bullish but could still see some sideways movement before it takes off again.
BTC/USD Long-term Trend: Bullish (Daily Chart)
Key levels:
Resistance Levels: $19,500, $19,700, $19,900
Support Levels: $16,200, $16,000, $15,800
BTC/USD is now back on track as the market price trades near the previous resistance level of $18,000, after sharply correcting to a low of $16,200 a few days ago. More so, the first digital asset appears unstoppable in the last couple of weeks, climbing higher every single day with only a few retracement periods. The volatility in the cryptocurrency market is extremely high right now with some altcoins jumping up and down as the RSI (14) remains above the 60-level.
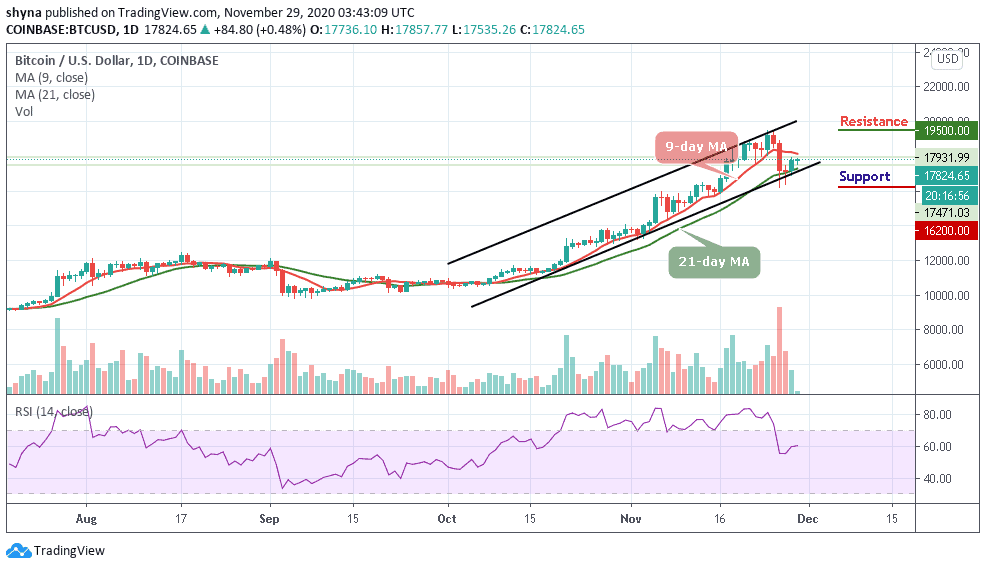
Would Bitcoin (BTC) Keep the Uptrend?
BTC/USD has been outperforming pretty much almost any other asset in the market. Bitcoin seems to be only facing one major barrier at $19,890 and cracking the all-time high could be a major achievement for the bulls which may potentially push the Bitcoin price towards the $20,000 level. However, if the bulls refused to reclaim the $18,000 level in the near-term, it could mean that a decline towards the support at $16,500 is imminent.
Therefore, if this level is broken, it could strike a serious blow to the cryptocurrency’s technical outlook. Meanwhile, an increase in selling pressure could see the Bitcoin drop to the supports of $16,200, $16,000, and $15,800 respectively. In other words, if the bulls continue to push the coin, crossing above the 9-day moving average may likely reach the resistance levels of $19,500, $19,700, and $19,900 as reveals by the technical indicator.
BTC/USD Medium-Term Trend: Bearish (4H Chart)
According to the 4-hour chart, BTC/USD may continue to move sideways as the technical indicator RSI (14) is seen moving in the same direction above the 50-level. If the market price stays above the 9-day and 21-day moving averages, it may persistently trade above the $18,500 resistance level in the nearest term.
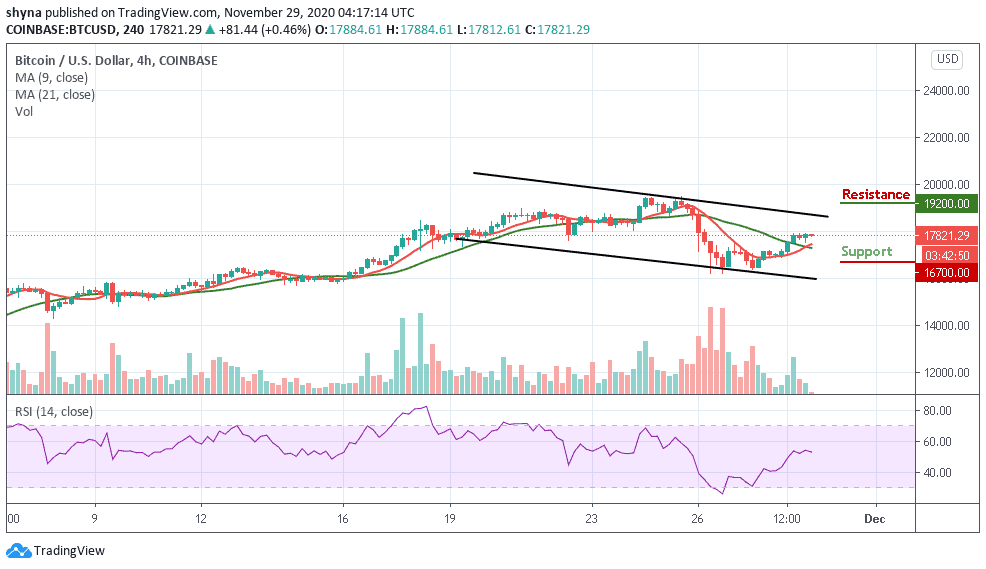
Meanwhile, BTC/USD is currently trading above the moving averages. The upward movement is likely to push the price to the resistance levels of $19,200 and above while the immediate support lies below the moving averages at $16,700, $16,500, and $16,300 levels.
Join Our Telegram channel to stay up to date on breaking news coverage