Join Our Telegram channel to stay up to date on breaking news coverage
LTC Price Prediction – November 26
LTC/USD is seen following the bearish trend as the sellers retain control of the market for the second straight day.
LTC/USD Market
Key Levels:
Resistance levels: $92, $97, $103
Support levels: $55, $50, $45
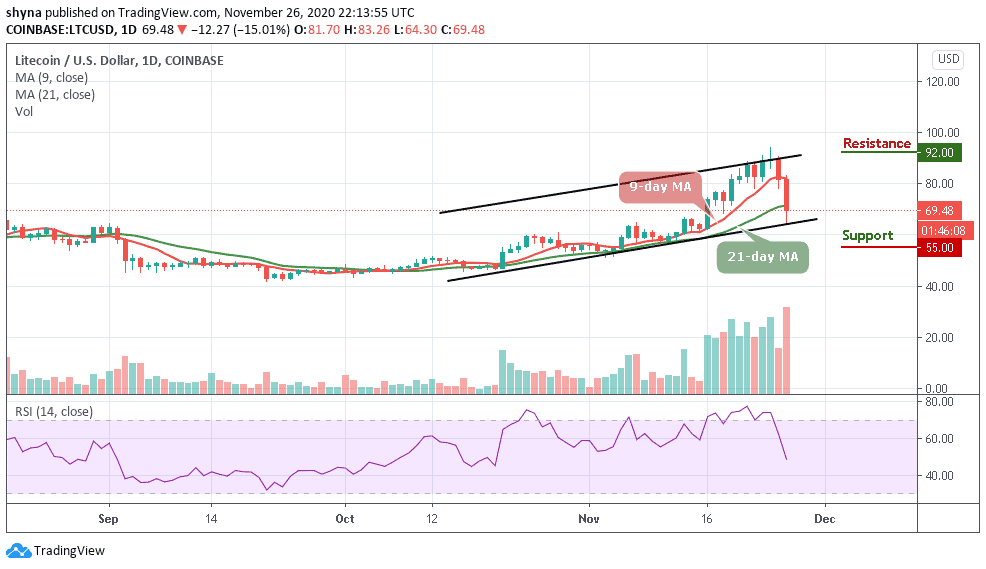
LTC/USD is currently changing hands at $69.48, down 15.01% on a day-to-day basis. The coin has recovered from the intraday low of $64.30, but the upside momentum is slow. As the daily chart reveals, the Litecoin price continues to move within a short-term bearish trend amid low volatility. However, if the market maintains positive momentum, LTC/USD may continue to respect the channel pattern. Otherwise, more breakdowns may play out.
What to Expect from the Litecoin (LTC)?
A possible retracement below the lower boundary of the 9-day and 21-day moving averages may likely drag the price to $55, $50, and $45 supports, creating a new monthly low. But if the market price decides to move above the 9-day and 21-day moving averages, buying pressure may further push the coin to the potential resistance at $85 and $90. Looking at the daily chart, there may be a need for a pullback so that the market may be able to regain strength in the nearest term.
However, a sustainable bullish movement is needed for the upside to gain traction with the next focus on $92, $97, and $103 resistance levels. On the contrary, the technical indicator RSI (14) nosedives below the 50-level, a possible cross below the 40-level may result in tremendous bearish movement.
Against Bitcoin, the Litecoin price is currently following a bearish sentiment, trading under the 9-day and 21-day moving averages within the ascending channel. However, if the bulls attempt to gain momentum, the bears are likely to keep releasing huge pressure on the market as the technical indicator RSI (14) slides below 50-level, suggesting more bearish signals.
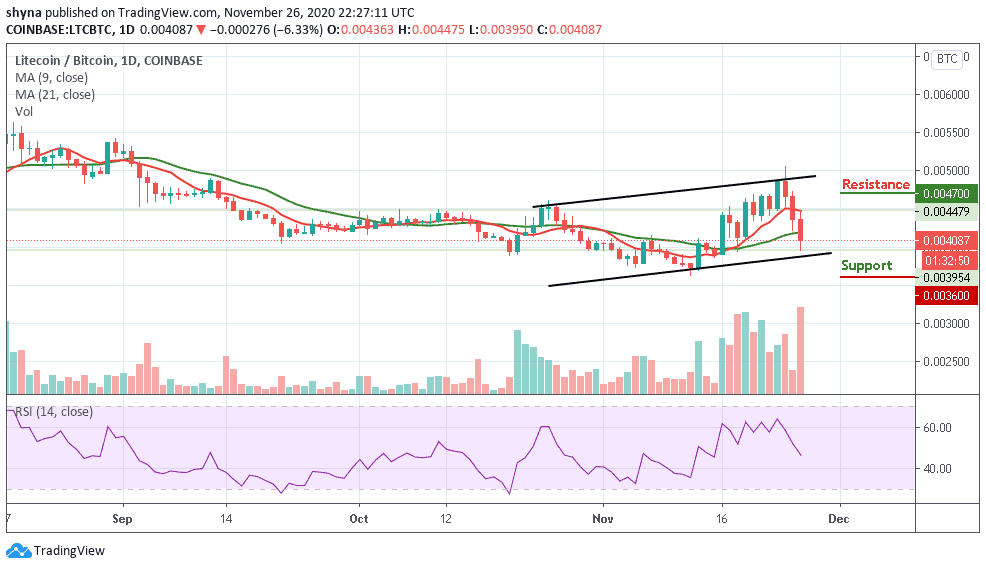
However, if LTC/BTC falls below the lower boundary of the channel, it may likely hit the nearest support at 3800 SAT. Any further negative movement could significantly lower the price to 3600 SAT and below. Should in case a rebounds came to focus, the coin may test the 4600 SAT above the moving averages before resuming the rally. If the bulls manage to stay well above this barrier, traders could see a bull-run to the resistance level of 4700 SAT and above.
Join Our Telegram channel to stay up to date on breaking news coverage