Join Our Telegram channel to stay up to date on breaking news coverage
Bitcoin (BTC) Price Prediction – November 26
Today, the Bitcoin price is seen plunging from $18,915 to touch the low of $16,200.
BTC/USD Long-term Trend: Bullish (Daily Chart)
Key levels:
Resistance Levels: $20,000, $20,200, $20,400
Support Levels: $15,000, $14,800, $14,600
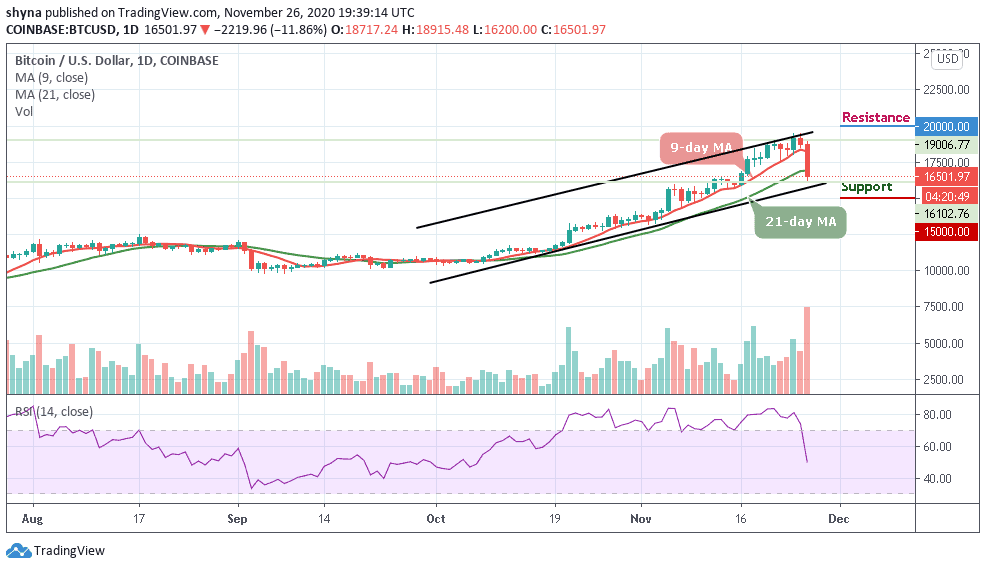
BTC/USD drops below $19,000 during the early Asian hours of trading but the coin failed to recover above the critical level so far. At the time of writing, the price of Bitcoin is moving around $16,501 as the coin is down by 11.86% within 24 hours. The number one cryptocurrency hit a brick wall on the approach to $19,000 and now moves under the 9-day and 21-day moving averages.
What to Expect from Bitcoin (BTC)
An upside break above the moving averages is a must to start a substantial recovery. Once this happens, the next hurdles may be seen near the resistance levels of $20,000, $20,200, and $20,400. On the downside, initial support is near the lower boundary of the channel at the $16,500 level and if there is a successful break below this level, the bears are likely to gain strength by bringing the price to a low of $15,000, $14,800, and $14,600 respectively.
Looking at it presently, BTC/USD is following a dominant bearish bias and a glance at the technical indicator RSI (14) displays a negative picture for the coin in the near-term. However, to maintain a gradual downward trend in the negative region, the signal line of RSI (14) may be decreasing as it faces a downward trend for an increase in selling entries.
BTC/USD Medium – Term Trend: Ranging (4H Chart)
Looking at the 4-hour chart, Bitcoin’s price is currently trading around $17,143 below the 9-day and 21-day moving averages after falling from $18,915 where the coin touched today. Whereas, the 4-hour chart shows that the bearish supply is coming up slightly in the market as0 the sellers are trying to drag the price down.
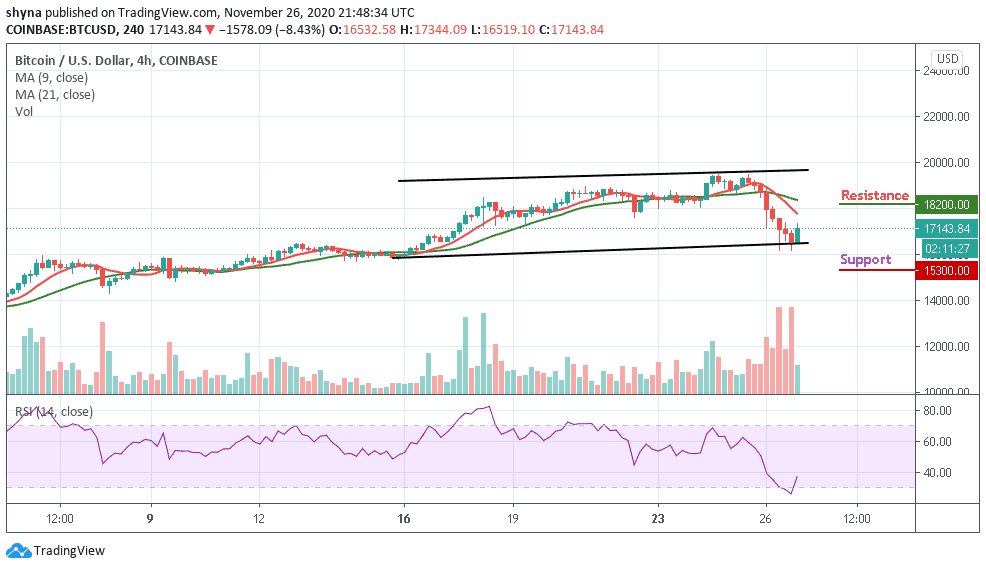
The technical indicator RSI (14) is recovering from the oversold. If the downward trend continues, keeping Bitcoin above $18,000 may be a daunting task. In this case, it is best we look at possible support levels, starting at $15,300, $15,100, and $14,900 while the potential resistance lies at $18,200 and above.
Join Our Telegram channel to stay up to date on breaking news coverage