Join Our Telegram channel to stay up to date on breaking news coverage
LTC Price Prediction – November 9
The Litecoin price is following the bearish movement as the coin falls from its range.
LTC/USD Market
Key Levels:
Resistance levels: $68, $70, $72
Support levels: $52, $50, $48
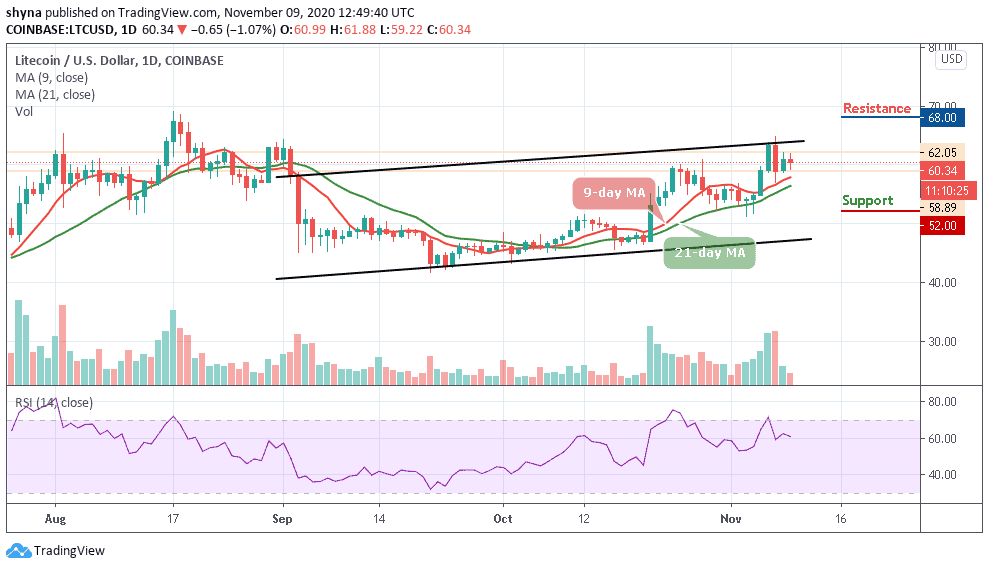
LTC/USD is currently changing hands at $60.34, down 1.07% on a day-to-day basis. The coin has recovered from the intraday low of $59, but the upside momentum is slow. Therefore, the Litecoin price continues to move within a short-term bearish trend amid low volatility. More so, if the market regains the positive momentum, LTC/USD price may continue to respect the channel pattern. Otherwise, more breakdowns may play out.
What is the Next Direction for Litecoin (LTC)?
A possible retracement below the 9-day and 21-day moving averages within the channel may bring the price to $52, $50, and $48 supports, creating a new monthly low. But if the market price decides to move above the upper boundary of the channel, buying pressure may further recover to the potential resistance at the $64 and $66. As it appeared now, there’s a need for a pullback for the market to regain strength.
Meanwhile, a sustainable bullish movement is needed for the upside to gain traction with the next focus on $68, $70, and $72 resistance levels. On the contrary, the technical indicator RSI (14) nosedives below the 40-level, any additional crossing below this level may result in tremendous bearish movement.
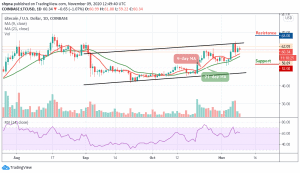
When compares with Bitcoin, the Litecoin price is currently following a bearish sentiment, trading under the 9-day and 21-day moving averages within the descending channel. However, if the bulls attempt to gain momentum, the bears are likely to keep releasing huge pressure on the market as the technical indicator RSI (14) slides below 40-level, suggesting more bearish signals.

However, if LTC/BTC falls below the lower boundary of the channel, it may likely hit the nearest support at 3600 SAT. Any further negative movement could significantly lower the price to 3500 SAT and below. In case of a rebound, the coin can test the 4200 SAT above the moving averages before resuming the rally. If the bulls manage to stay well above this barrier, traders could see a bull-run to the resistance level of 4300 SAT and above.
Join Our Telegram channel to stay up to date on breaking news coverage