Join Our Telegram channel to stay up to date on breaking news coverage
LTC Price Prediction – August 24
Since a few days ago, Litecoin (LTC) has been growing steadily within the channel.
LTC/USD Market
Key Levels:
Resistance levels: $70, $72, $74
Support levels: $50, $48, $46
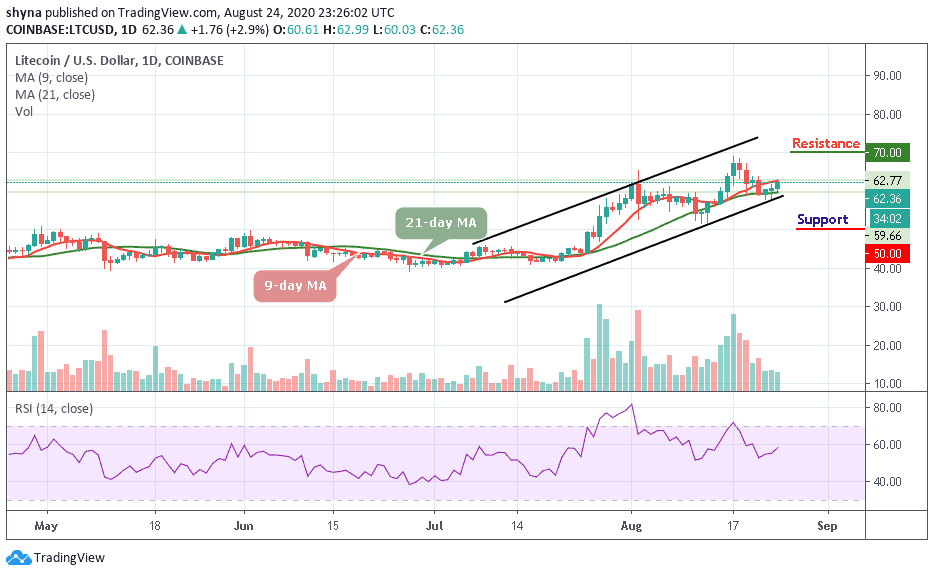
LTC/USD has been gaining around 2.9% in the recent 24 hours to trade at $62.36 at the time of writing. The coin has been one of the best-performing coins out of top-10 today as the upside momentum has been gaining traction since the weekend. However, LTC/USD dipped to the psychological $59.66 during early Asian hours before the recovery resumed.
Would Litecoin (LTC) Maintain the Uptrend?
The market price is currently displaying a sign of subduing volatility, ready to cross above the 9-day and 21-day moving averages. Meanwhile, taking a look at the daily chart, we can see that the trading volume is steady while the technical indicator RSI (14) moves to cross above the 60-level which are suggesting more bullish signals.
Nevertheless, if the Litecoin price remains under the control of the bulls, it may likely roll to the nearest resistance at $70, $72, and $74 levels. On the downside, any bearish movement below the lower boundary of the channel could bring the market price to the support level of $50, $48, and $46 respectively.
When compares with BTC, the bulls are making a serious effort to step back into the market. At the moment, the coin is trying to show some promising signs that could push the coin above the 9-day and 21-day moving averages. From the upside, the nearest resistance levels are located at 5600 SAT and above.
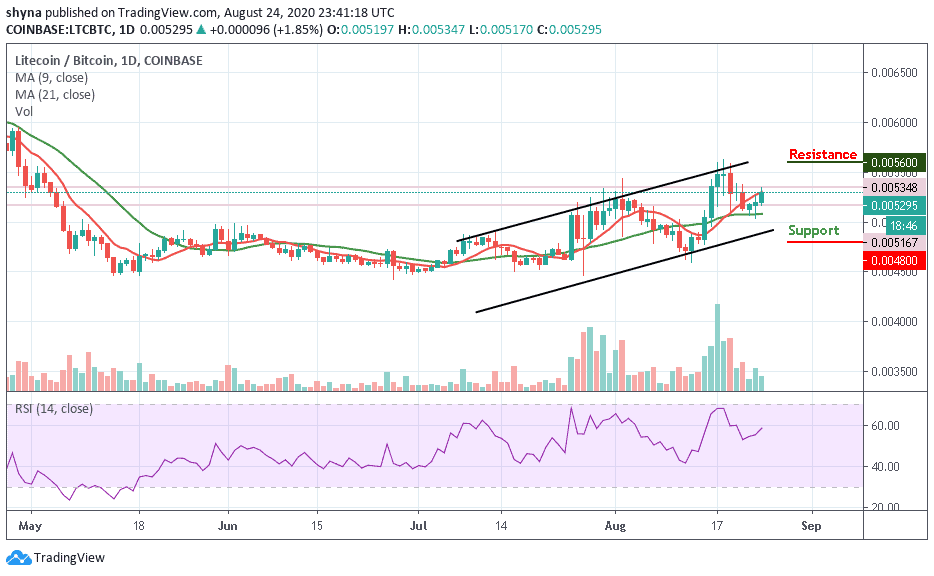
Meanwhile, from the downside; the nearest support levels lie below the 9-day and 21-day moving averages. Beneath this, further support lies at 5000 SAT. If the price drops further below the lower boundary of the channel, the lower support may be located at 4800 SAT and below. Meanwhile, the technical indicator RSI (14) is making an attempt to cross above the 40-level, which shows that the more bullish signals may come to play.
Join Our Telegram channel to stay up to date on breaking news coverage