Join Our Telegram channel to stay up to date on breaking news coverage
LTC Price Prediction – September 27
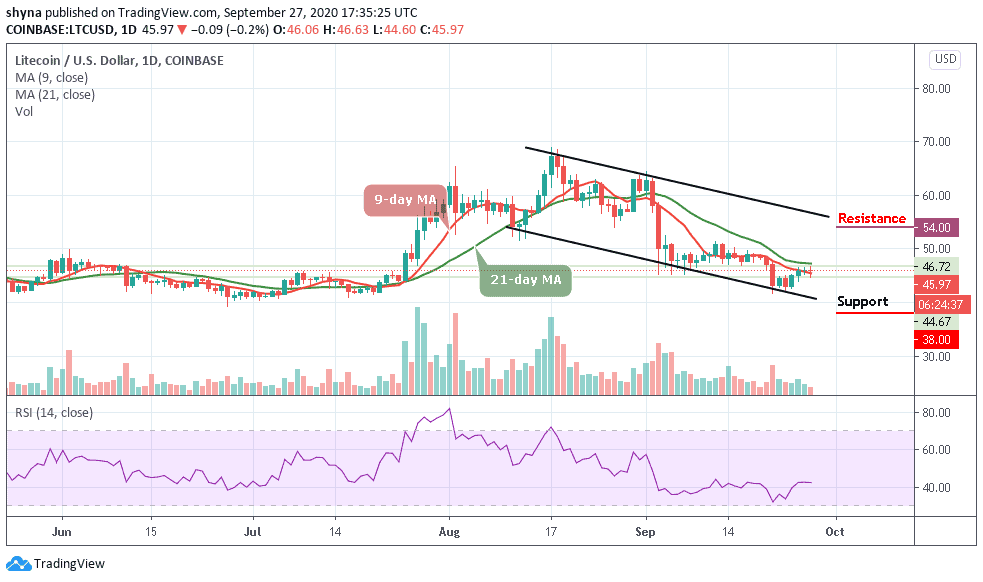
The LTC/USD may be looking for support at $40, where the market is likely to provide a rebound level for the price.
LTC/USD Market
Key Levels:
Resistance levels: $54, $56, $58
Support levels: $38, $36, $34

The daily movement of LTC/USD has not been impressive since August 18. Most importantly, if the Litecoin (LTC) improves in the last hours of the day, the intraday traders may expect a positive close. At present, most of the top cryptocurrencies are under tremendous selling pressure.
Where is LTC Price Going Next?
The Litecoin price may continue to experience a downtrend if it falls beneath the support at $40. However, if the sellers do push Litecoin beneath the mentioned-support, provided by the short term, traders can expect additional support at $38. This is then followed with added support at $36 and $34 levels below the 9-day and 21-day moving averages.
On the upside, resistance lies at $46 and $48 which is above the moving averages, higher resistance lies at $54, $56, and $58. The technical indicator RSI (14) is moving around 42-level which reveals that the sellers may continue to dominate the market momentum. For any bullish movement, the technical indicator would need to climb above 50-level for the market to embark on the upward movement.
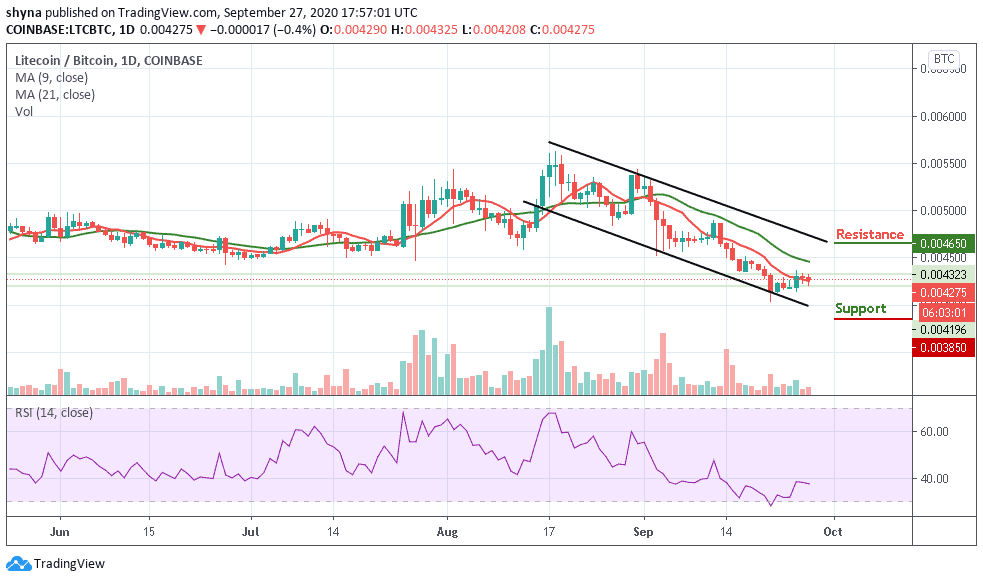
Comparing with BTC, the daily chart reveals that the coin is moving sideways. At the moment, the market price is falling as the sellers are posing more threat to the 4200 SAT support level where the nearest target lies. Meanwhile, an eventual break may likely lead to the collapse of the coin.

However, as the technical indicator, RSI (14) moves below 40-level as the coin is still above the 9-day moving average. Therefore, any further bearish continuation could meet the major support at 3900 SAT before falling to 3850 SAT and below. But if the buyers could summon the courage and return the price back above the 21-day moving average, it may likely hit the potential resistance at 4650 SAT and above.
Join Our Telegram channel to stay up to date on breaking news coverage

